GraFT-App Installation
Download our latest stand-alone or MATLAB App available here. Currently, we only have support for Windows Stand-Alone application.
Learn how to install GraFT-App on your system. Follow the step-by-step guide to get the application up and running.
System Recommendations
To fully utilize the parallel processing optimizations, CPU should have 4+ cores and 8+ logical processors, 16GB or more RAM, and a capable GPU.
System used for the creation of GraFT-App and its tutorials had the Intel i7 13700K (16 cores, 24 logical) CPU, 64GB DDR4 RAM, and NVIDIA's RTX-3080 GPU. You can compare your CPU at UserBenchmark.com here and your GPU here.
Using MATLAB
-
1
Dependencies
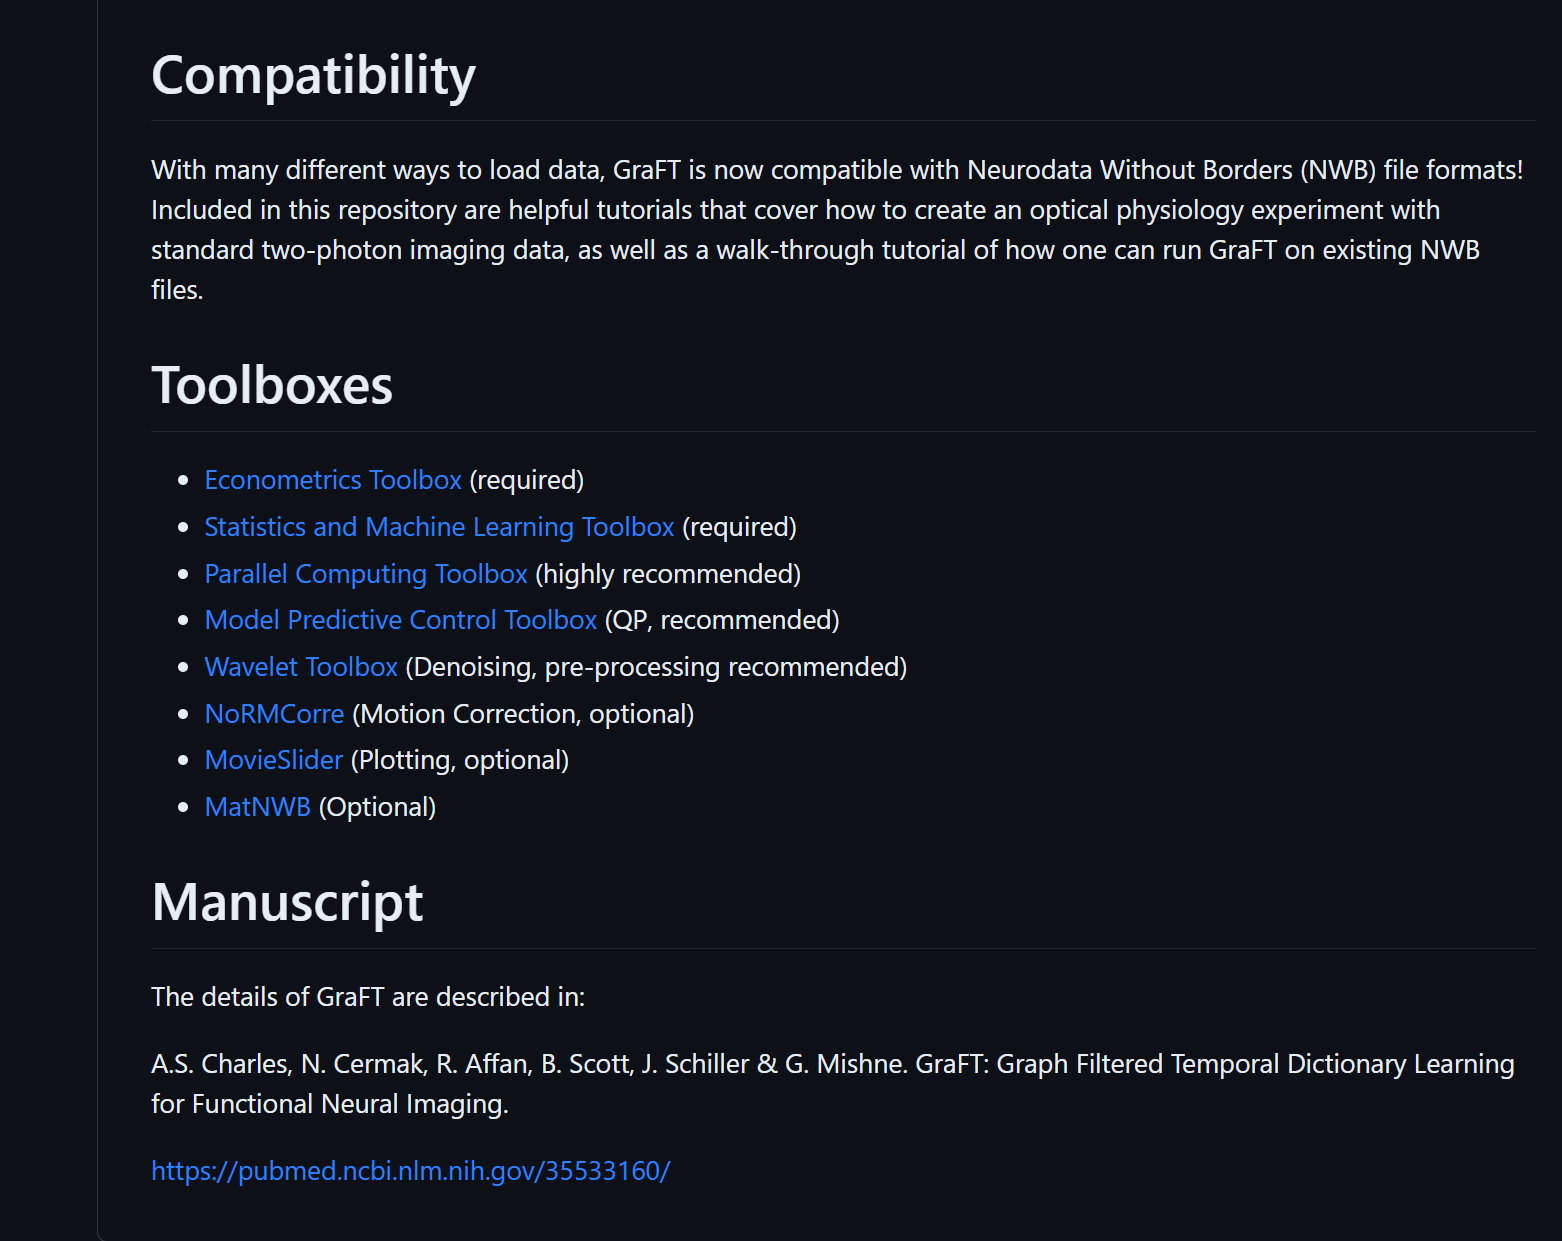
Amongst the various toolboxes required to run GraFT, there are a few other toolboxes that are recommended for faster, more efficient run times. Visit the official GraFT-Analysis website to view the most up-to-date information on dependencies.
Note: Updating MATLAB versions sometimes results in toolbox pathing errors. If you update your system, ensure toolbox support is still present by going to the Add-On Manager (Home tab and select Add-Ons > Manage Add-Ons).
-
2
Download the Installer
Visit the GraFT-App website and download the latest .mlappinstall file.
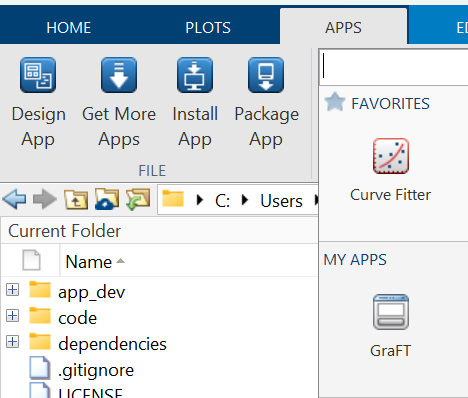
To install an add-on in the MATLAB Current Folder browser, double-click the file. An installer opens to guide you through the installation process. Alternatively, under APPS tab, select Install App and select the .mlappinstall file.
After installing, the GraFT app should be visible like shown in the image.
Using Stand-Alone Application
Currently, only Windows OS has been tested and confirmed support for installing GraFT-App. Support for Linux and iOS is our top priority and will be coming soon.
-
1
Download
Visit the GraFT-App website for installer download or simply click the download button above ('Win64 Stand-Alone'). This will download a file named: MyAppInstaller_web.exe. The '_web' within the name indicates that internet is required for initial installation.
-
2
Install
Follow the instructions on the installer and specify a path if that is desired.
Once downloaded, locate its location and double click GraFT_App to run. Alternatively, run GraFT_App.exe from the terminal to launch.
Files
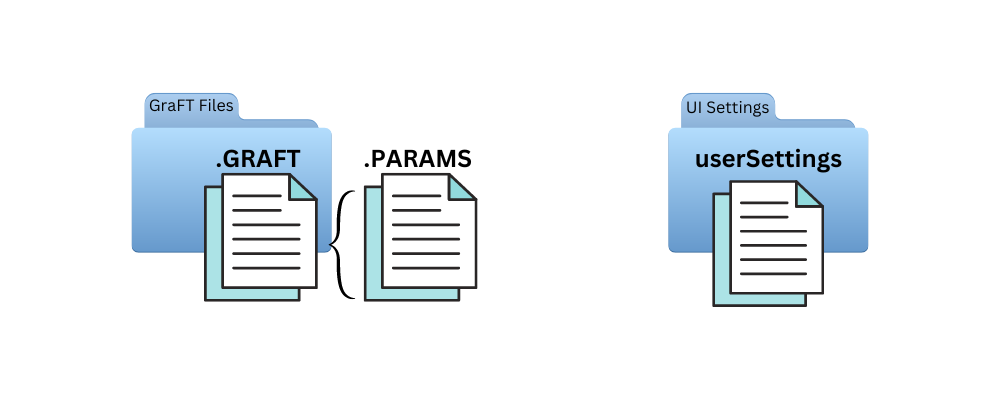
GraFT-App uses .mat files for storing parameters, results, and personal app settings. These can be loaded into MATLAB using the load(file_name) function or directly using the GraFT-App option. PARAMS files only contains parameter information while GRAFT files contain everything else data-specific such as original data, pre-processing settings, GraFT algorithm results, etc. Importantly, GRAFT files by default contain its associated PARAMS file.
To minimize redundant data within GRAFT files, users can explicitly decide what is saved and what is discarded prior to saving results. Moreover, non-MATLAB users will have a choice to export these files as text or csv (currently in development).
-
GRAFT
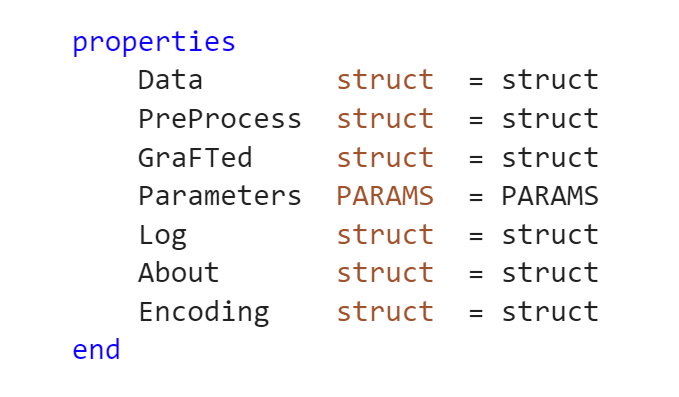
Holding all of the data pertaining to the current study is the .GRAFT.mat file. It's designed as a MATLAB Class object (Class GRAFT) where each property is organized to fit about a GraFT-analysis workflow.
Each property within the GRAFT -mat type file is as follows: Data, PreProcess, GraFTed, Parameters, Log, About, and Encoding. Furthermore, each of these properties contain a MATLAB structure. More information regarding individual properties below.
Users have complete control to decide what to save specifically from within each property.
If user does not specify GRAFT study file name, the default structure for file is as follows: 'dict[number of components]_lda[sparsity constraint (lambda)]_lfb[component regularization (lamForb)] _lcr[temporal correlation regularization (lamCorr)]_date[month_day_year].GRAFT.mat.
GRAFT Property: Data
GRAFT Property: About
GRAFT Property: PreProcess
GRAFT Property: GraFTed
GRAFT Property: Encoding
GRAFT Property: Log
-
GRAFT Property - PARAMS
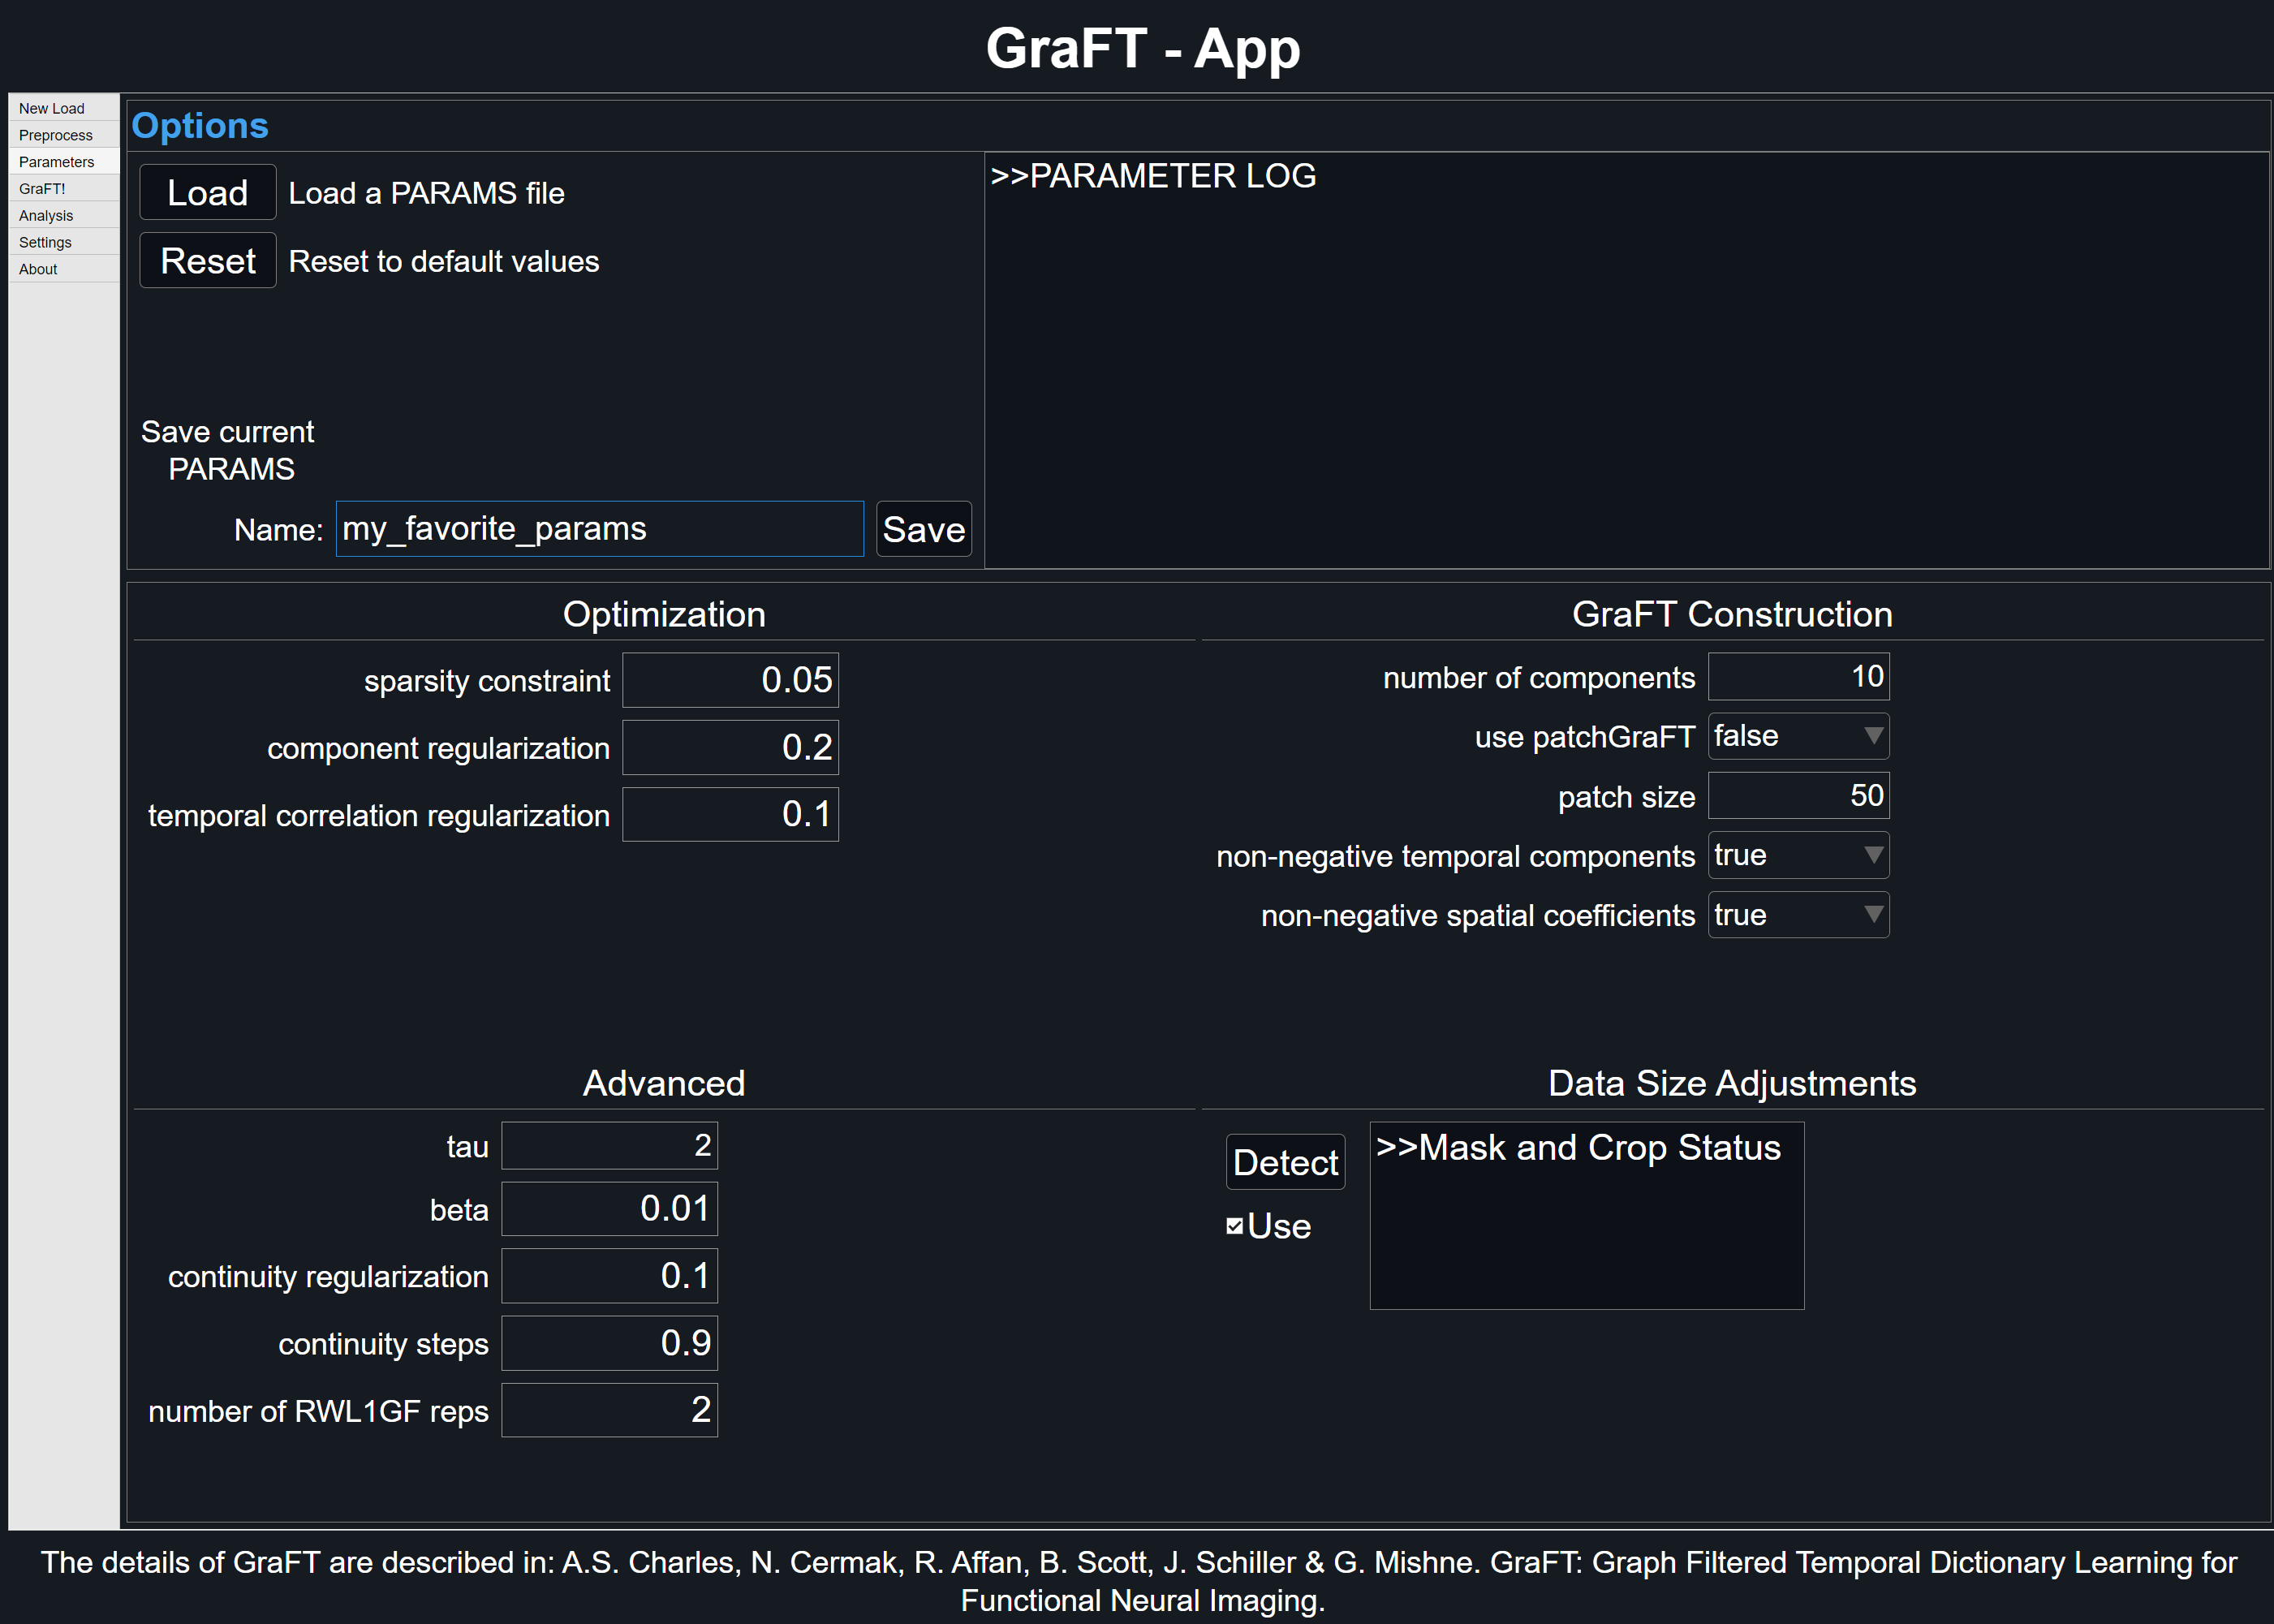
The .PARAMS.mat file format holds all the GraFT algorithm parameters that are user-configurable. Within the GraFT-App, the 'Parameters' tab will show all available variables and indicate when a crop or mask is present. Click on 'Detect' to update mask or crop status.
To better identify the PARAMS file, users can specify within the text area next to 'Name'. As stated earlier, the PARAMS file is automatically linked to its associated GRAFT file. To save PARAMS independently, clicking the 'Save' button in the 'Parameters' tab will export the current parameter settings.
The logic for having a .PARAMS file stems from the ease of sharing parameters between studies or users.
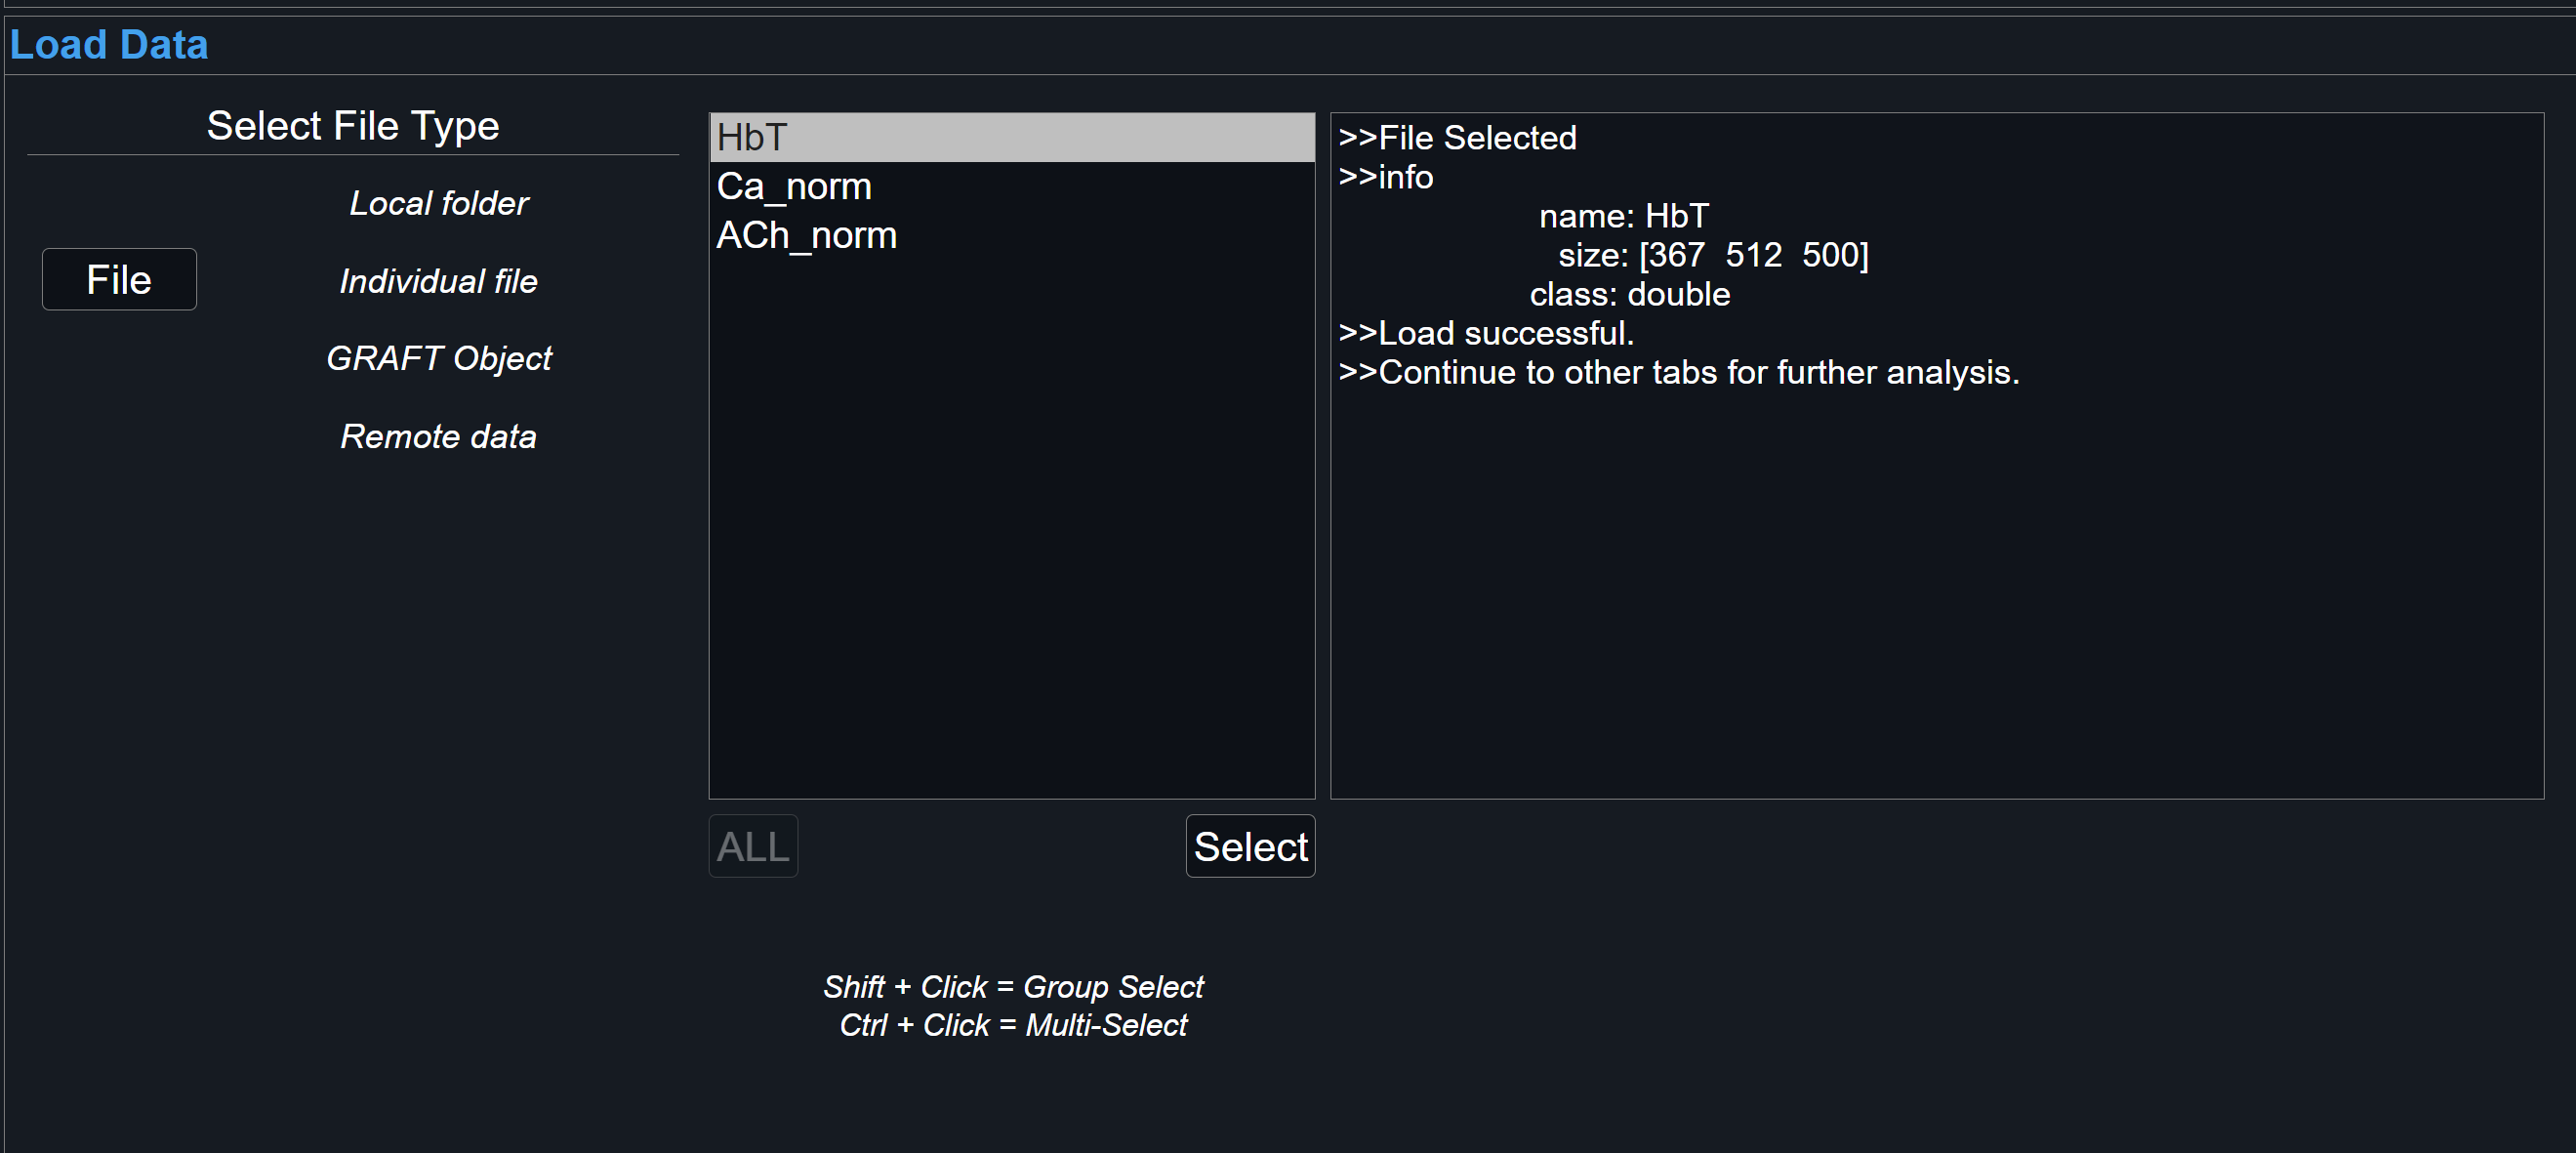
Loading Types
There are three types of loading: Folder, File, and GRAFT. Upcoming updates will support remote data alternatives, such as AWS S3.
File Type Support
Loading data within GraFT-App depends on the type of file. Currently, GraFT-App only supports .tiff, .npg and h5.
-
1
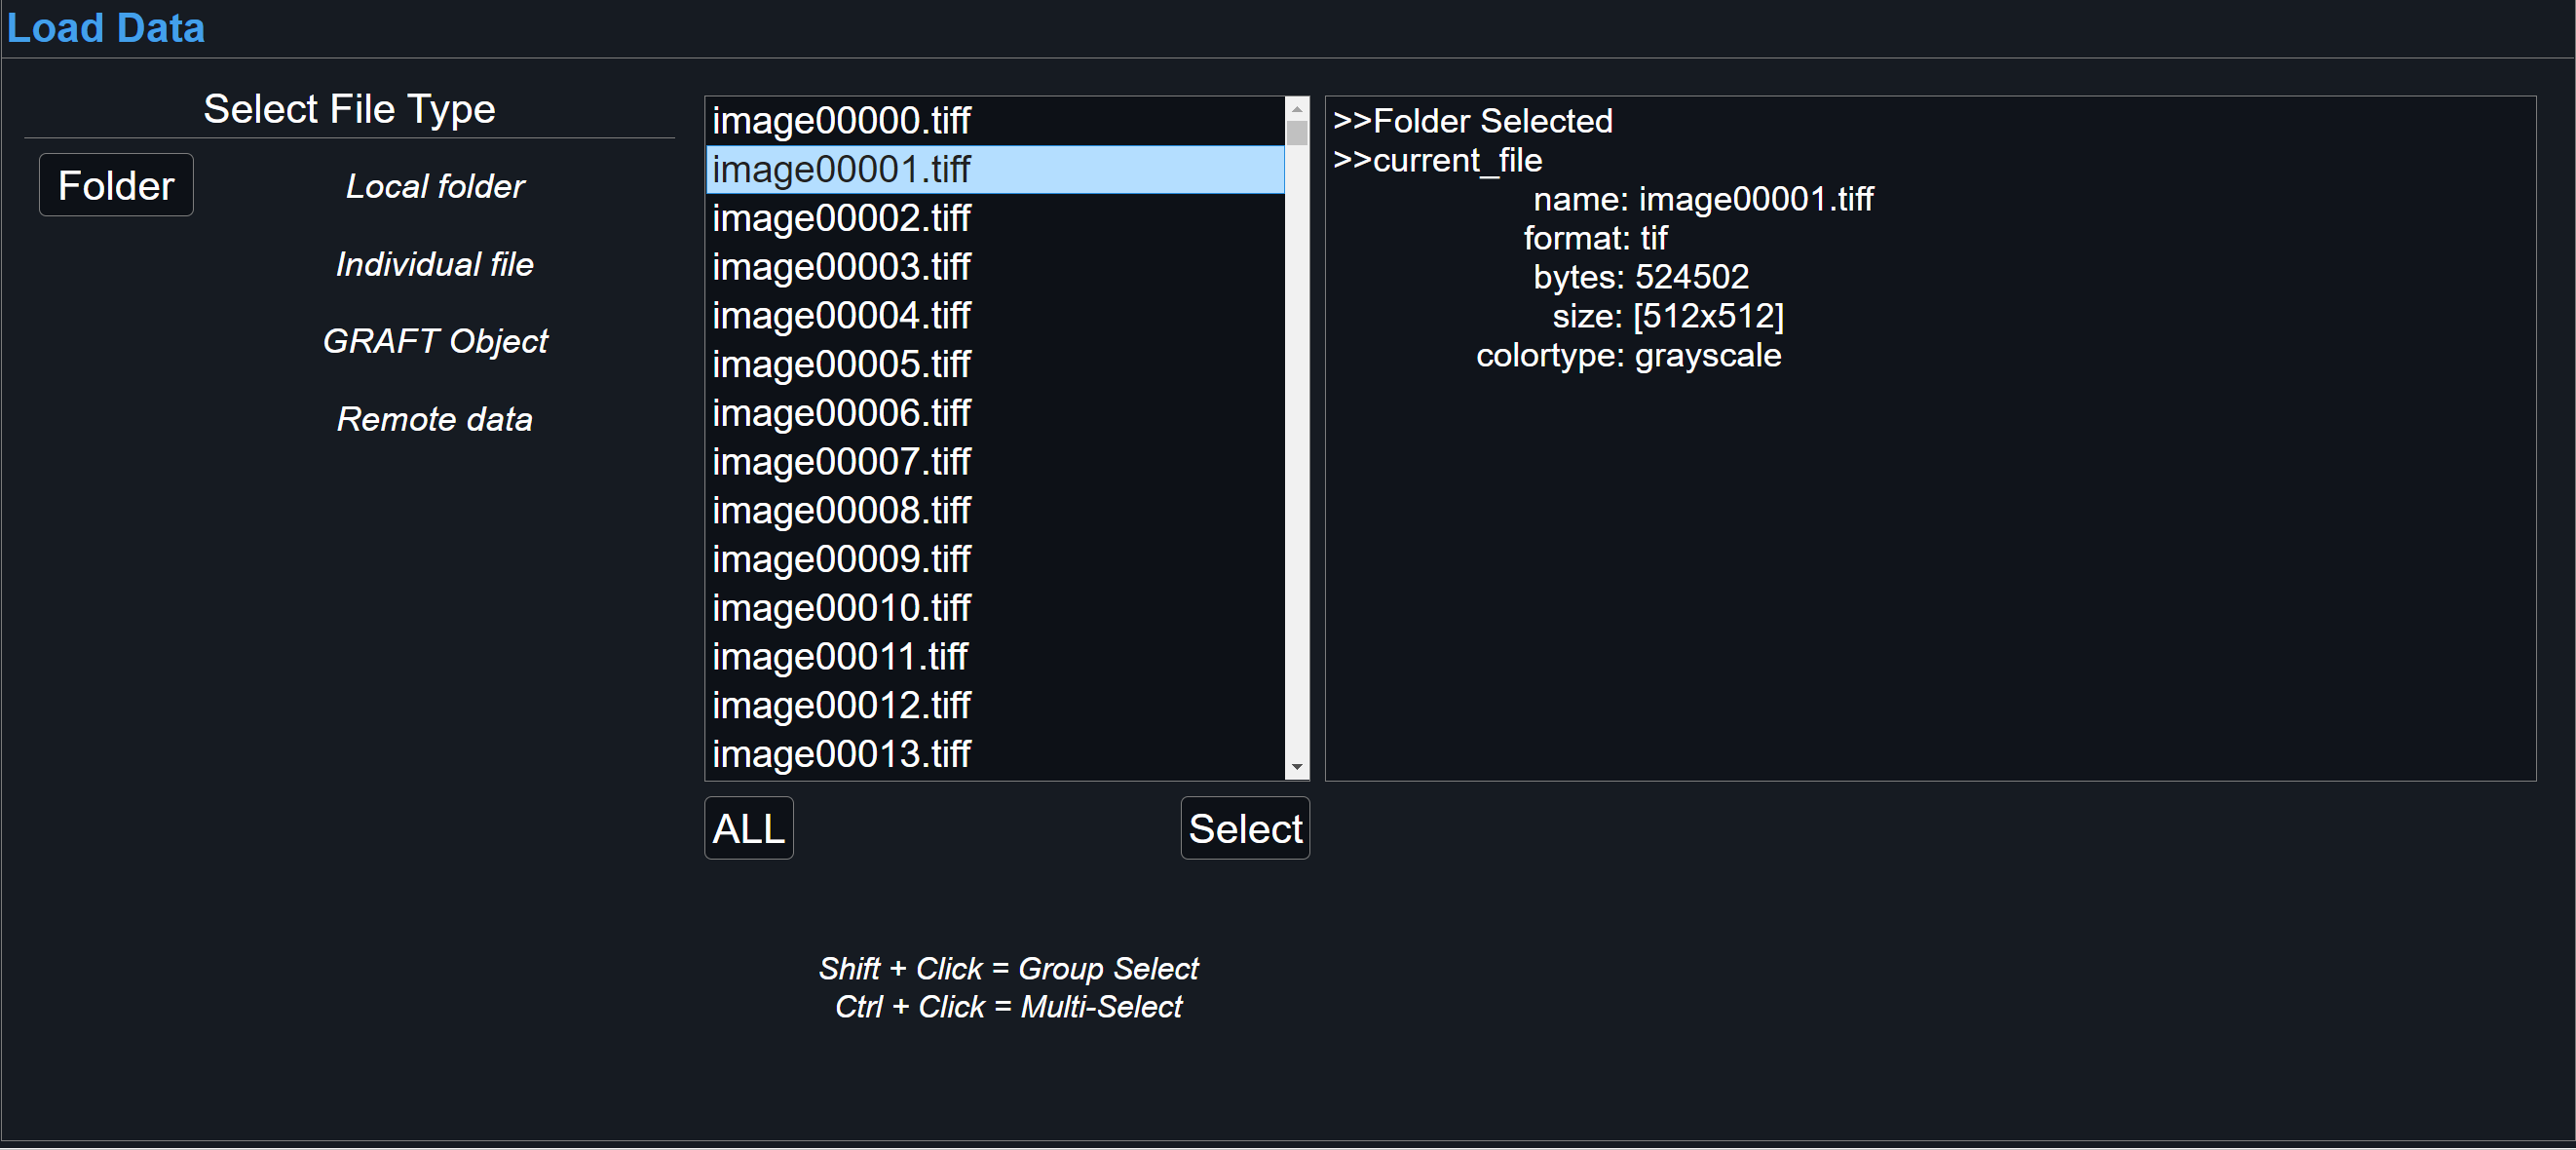
Folder
To load entire directory, selecting Folder will allow for supported files within chosen folder be loaded. More information about a specific file will be shown in the right-most dialog box after a selection. If all files are uniform within the directory, 'All' > 'Select' will be made available.
-
2
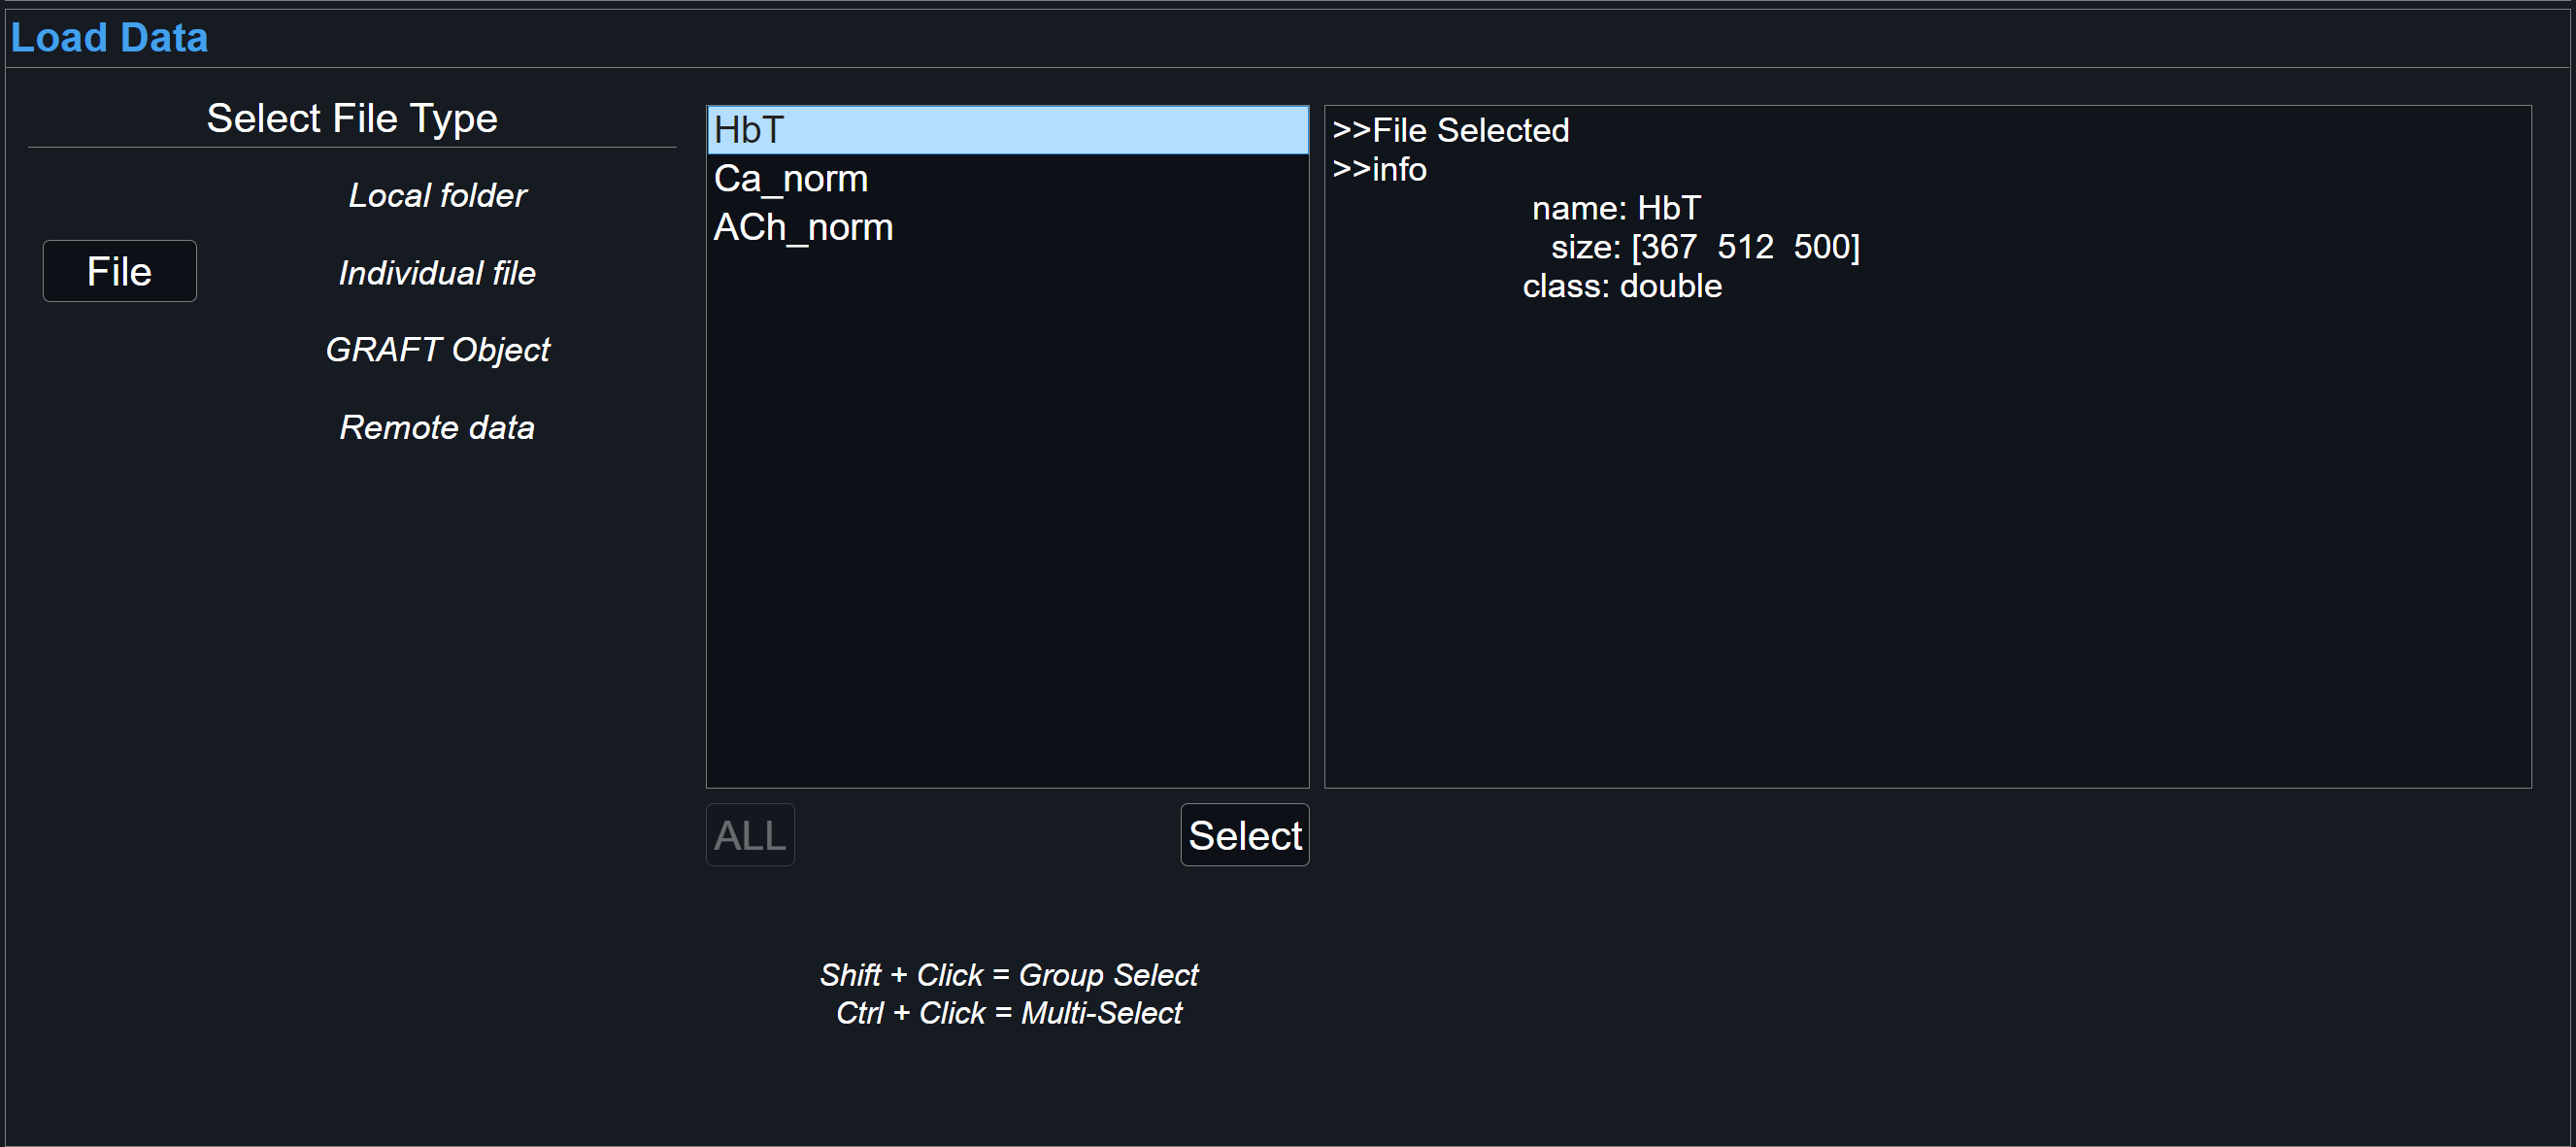
File
For individual files, either a TIFF image stack, individual .mat or h5 file, select File. For particular file types with nested structures, such as .mat or h5, further options will be shown for selecting correct fieldnames that contain desired data.
-
3
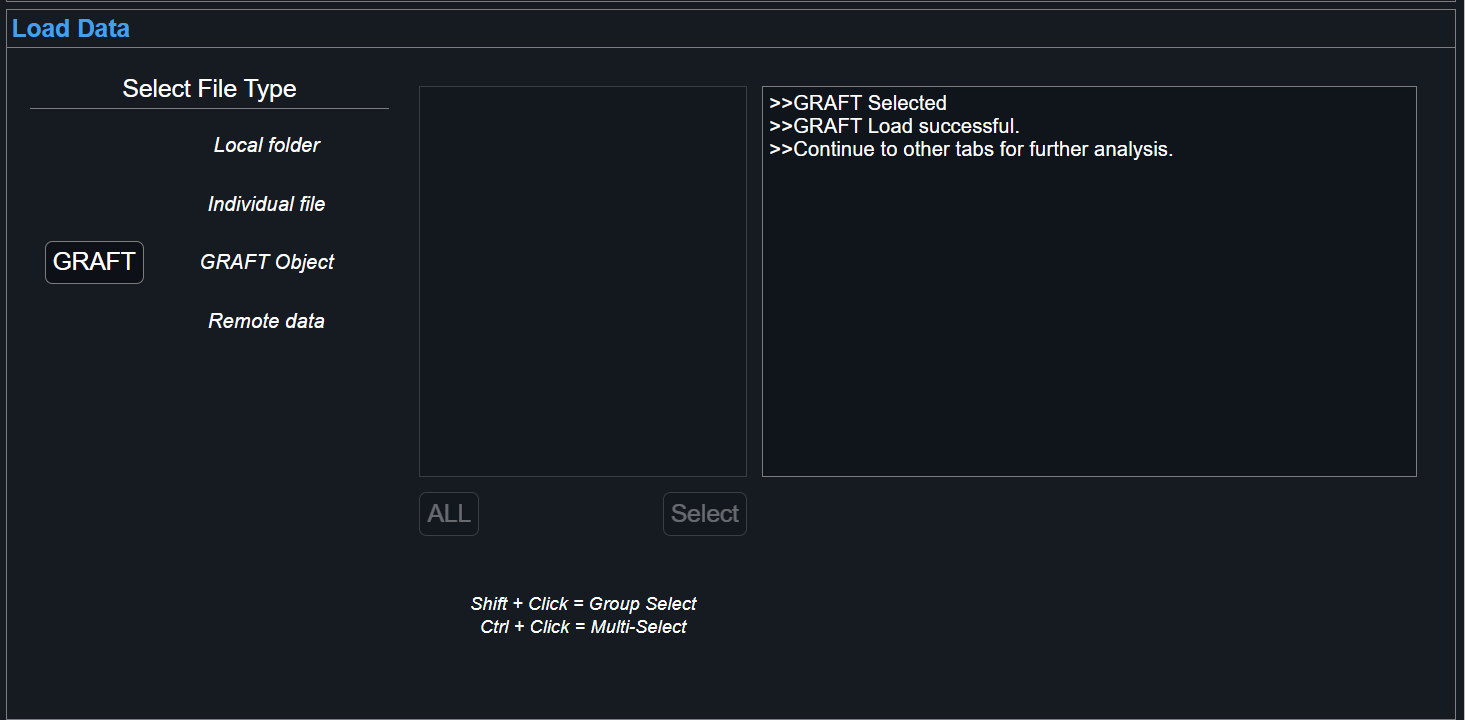
GRAFT Object
Lastly, it's possible to load GRAFT objects, which are native .mat-type files used for GraFT-App results. After running and saving results into a GRAFT file, it is possible to load data saved within for further analysis.
Confirmation
View the dialog box for system updates regarding proper loading. To load new file, selecting New Load button will reset GraFT-App and all its tabs.
Pre-Processing with GraFT-App
Useful techniques that GraFT-App offers for pre-processing calcium imaging data includes Motion Correction and Wavelet Denoising. Spatial filtering and baseline correction will also be available in future updates. These can be accessed through the Pre-Processing tab.
For specific pre-processing pipelines, it may be better suited for users to upload their processed data. GraFT algorithm results can change significantly due to pre-processing approaches.
Furthermore, GraFT-App allows users to alter data size via mask creation and data cropping options.
-
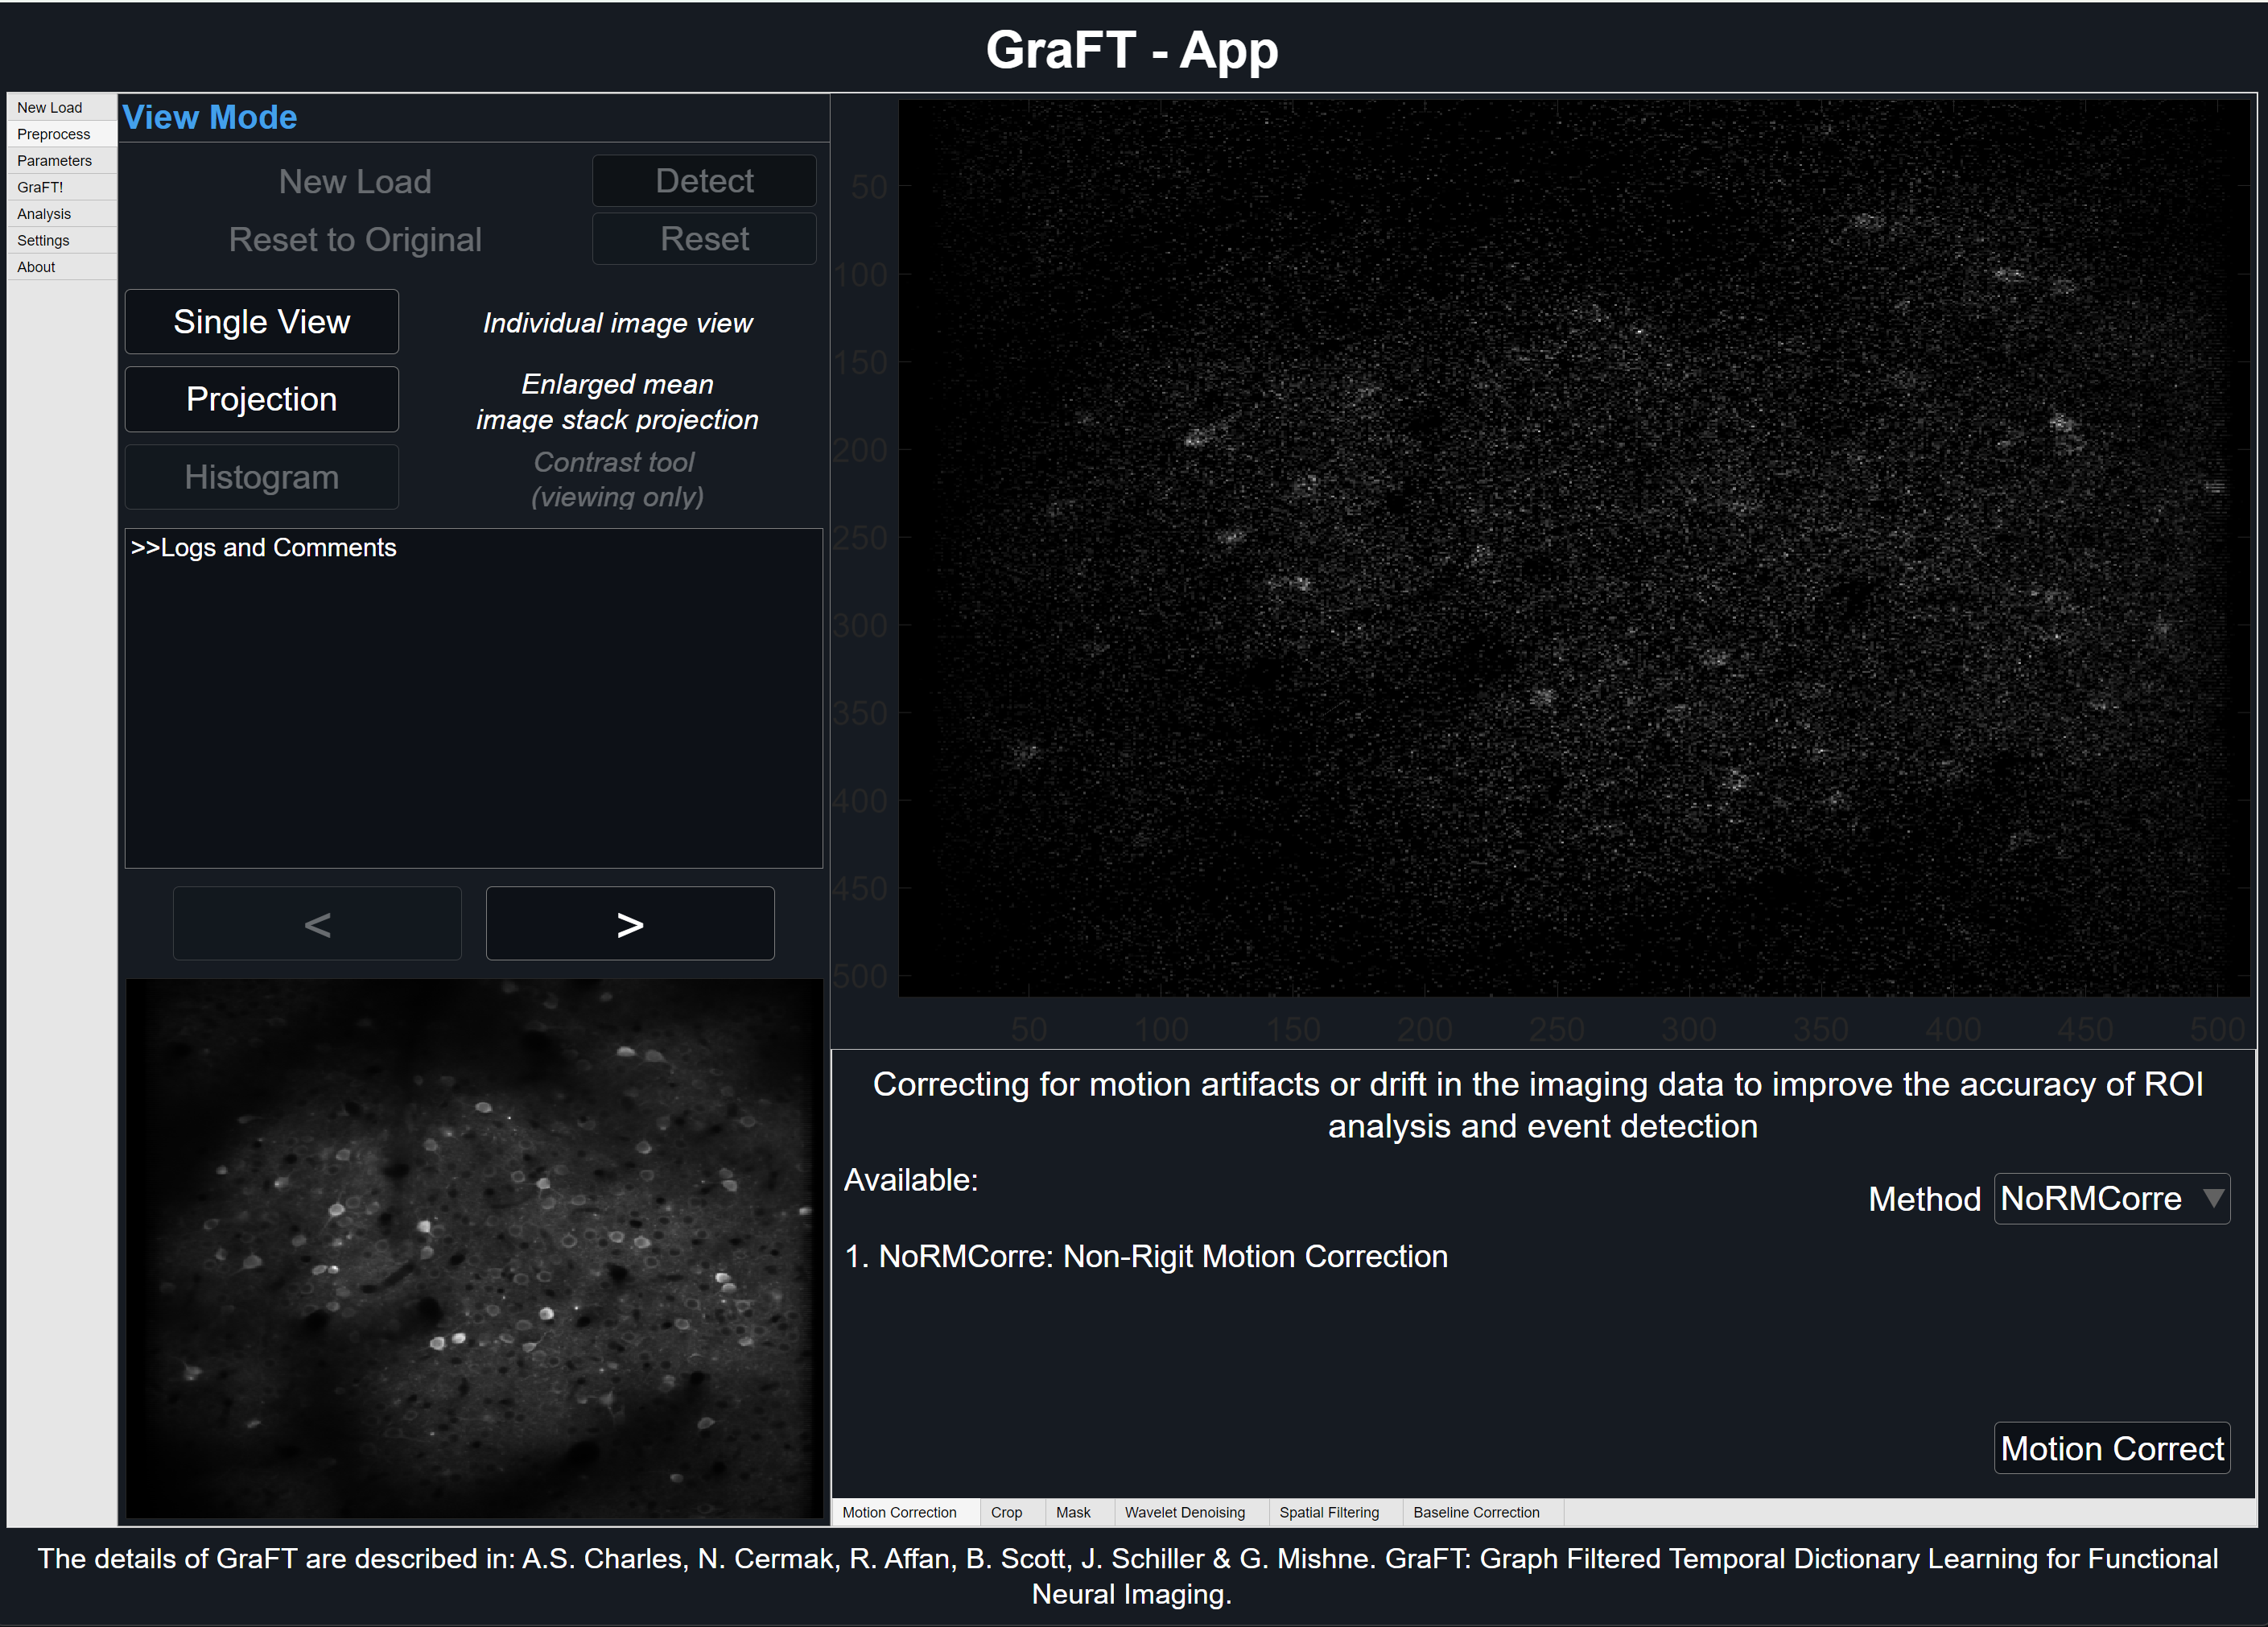
Motion Correction
Correcting for motion artifacts or drift in the imaging data can improve the accuracy of ROI analysis and event detection
GraFT-App uses NoRMCorre for piecewise rigid motion correction of 2D or 3D calcium imaging data. The algorithm operates by splitting the field of view into a set of overlapping patches. For each patch and each frame a rigid translation is estimated by aligning the patch against a template using an efficient, FFT based, algorithm for subpixel registration [2]. The estimated set of translations is further upsampled to a finer resolution to create a smooth motion field that is applied to a set of smaller overlapping patches.
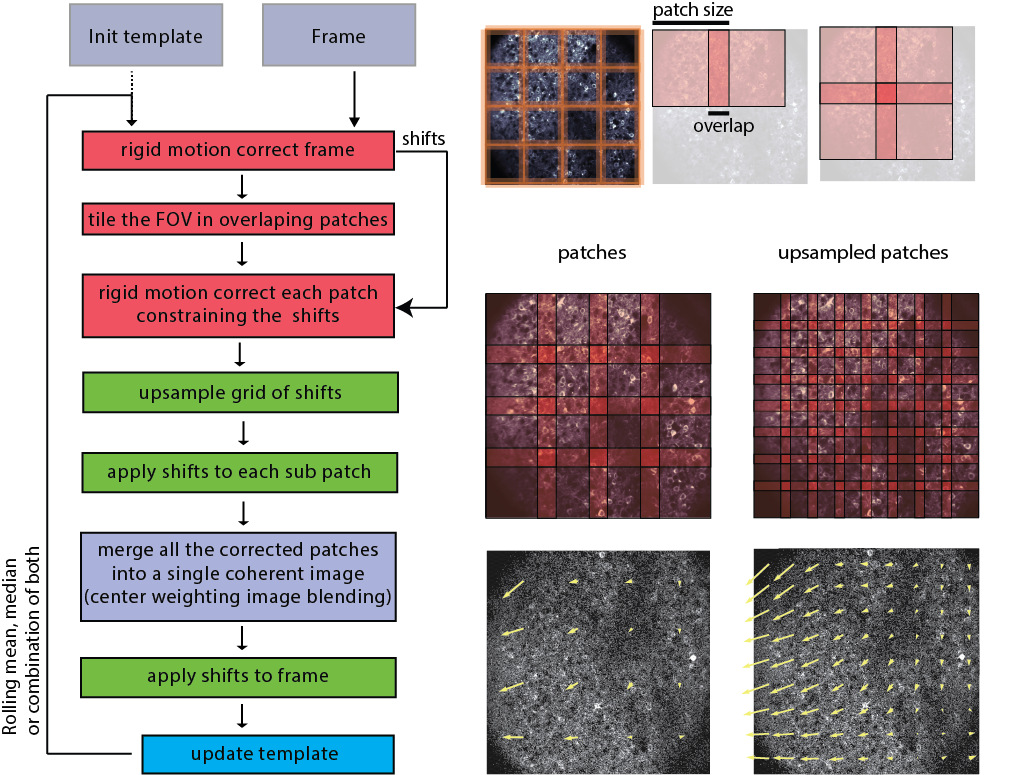
Image taken from NoRMCorre.
-
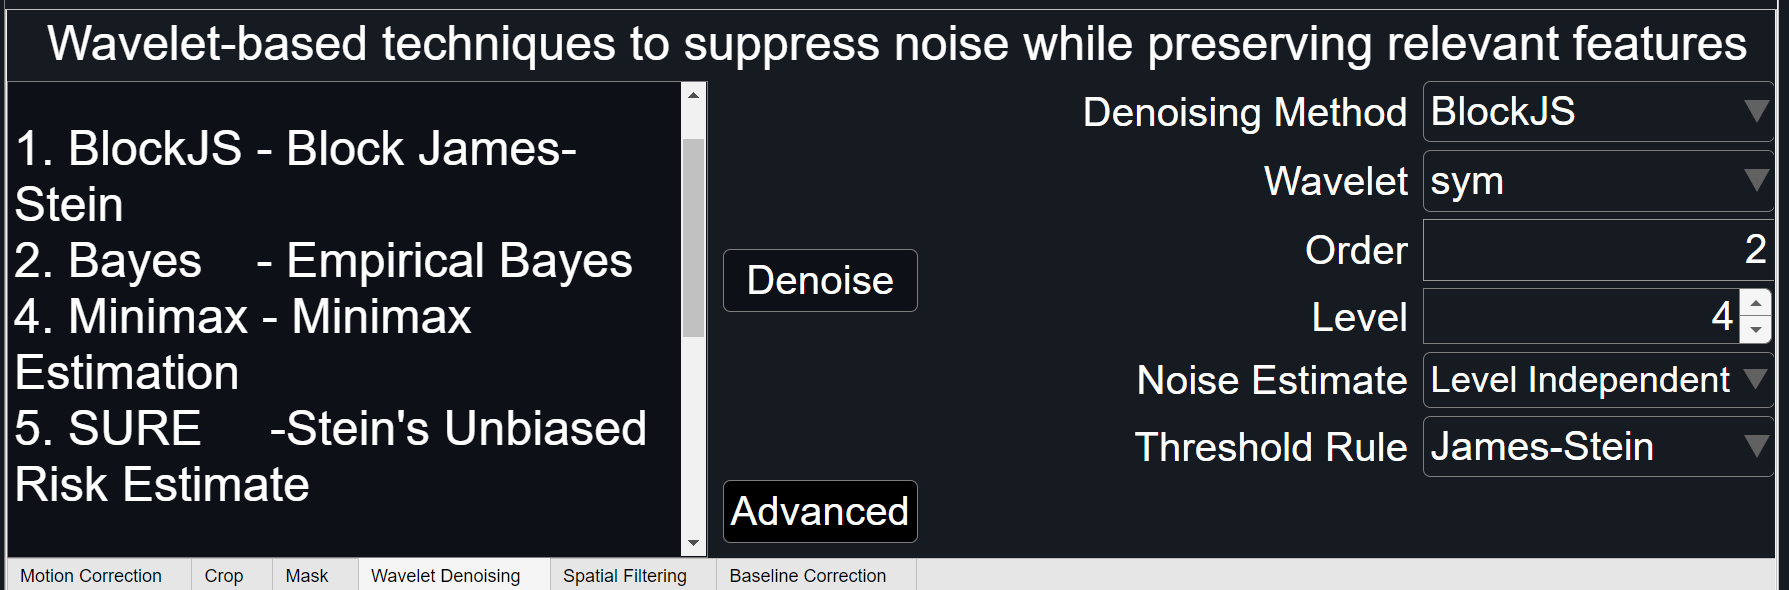
Wavelet Denoising
Wavelet-based techniques are useful for suppressing noise while preserving relevant features in the data.
GraFT utilizes the Wavelet Toolbox functions to provide users with various signal analysis methods. By default wdenoise is used with BlockJS denoising method, a sym4 wavelet, and a smoothing level of 4. Click on advanced for more options.
Altering Data Size
GraFT-App offers crop and mask options for further sub-selection of the loaded data, but they behave rather differently from each other. Crop will trim data that is currently loaded whereas mask will only take effect AFTER pre-processing (internally within GraFT algorithm).
Note: Consider timing of pre-processing techniques, such as performing motion correction before cropping, for best results. Crop and mask are mutually exclusive.
-
Crop
1Select 'crop' button and hover cursor over the large projection plot. After cursor changes from pointer to cross-hairs, press and hold left-click to begin tracing the rectangle-shaped area of interest. Release to finish the selection area.
Click and drag to re-position selected crop area, or click and drag corners/sides to further modify selection.
-
2
Select 'Apply' to crop selection on current data. This may take some time depending on the size of data.
Select 'Cancel' to remove selection.
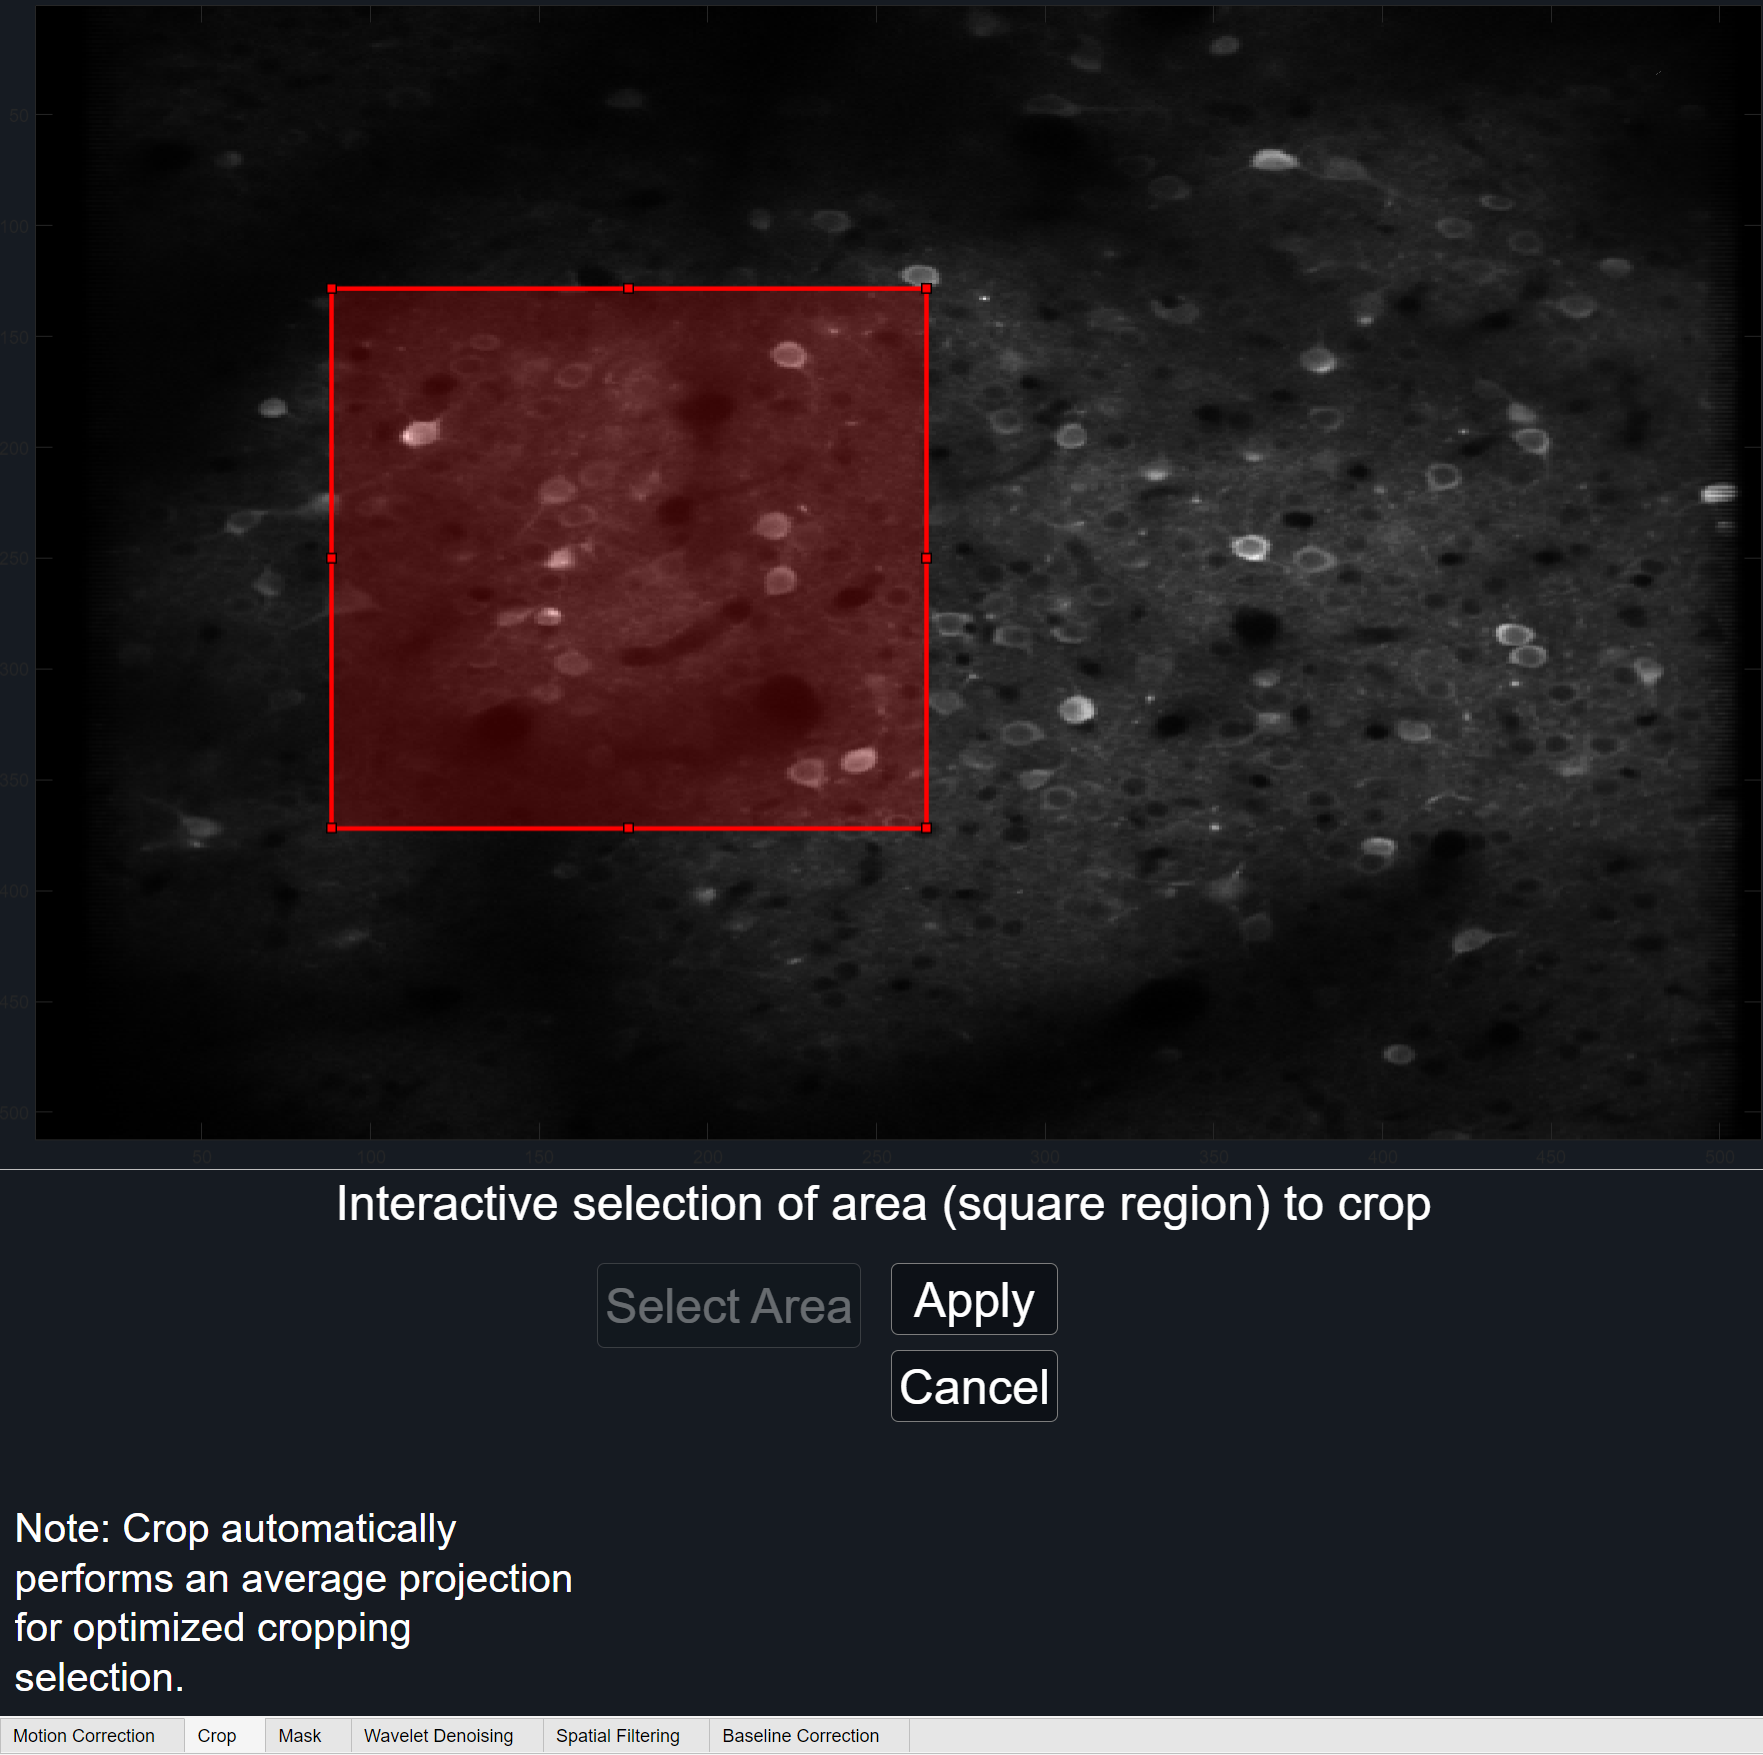
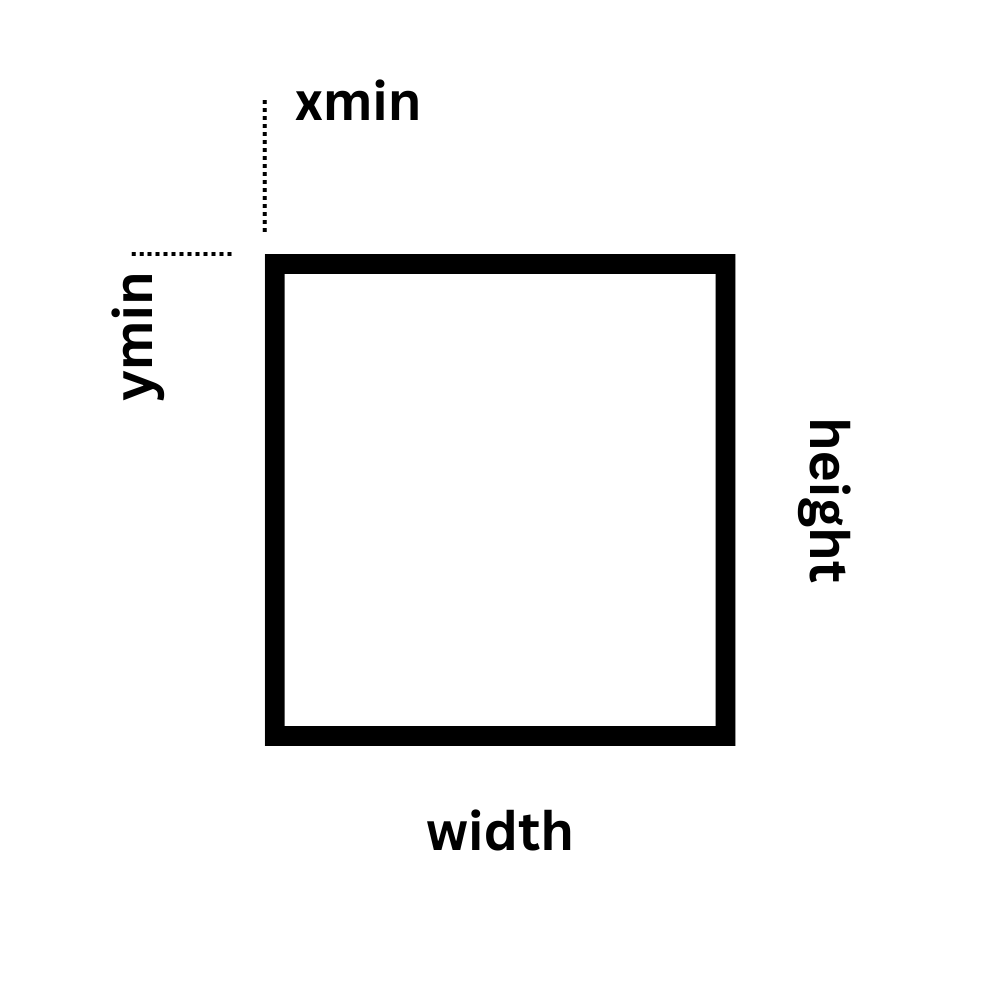
When crop is used, it will be reflected in the GraFT parameters. Specifically within the accompanying PARAMS file, the rectangle coordinates used will be saved under the 'crop' field. Rectangle coordinates indicate the size and position of the cropped rectangle as a 4-element numeric vector of the form [xmin ymin width height].
-
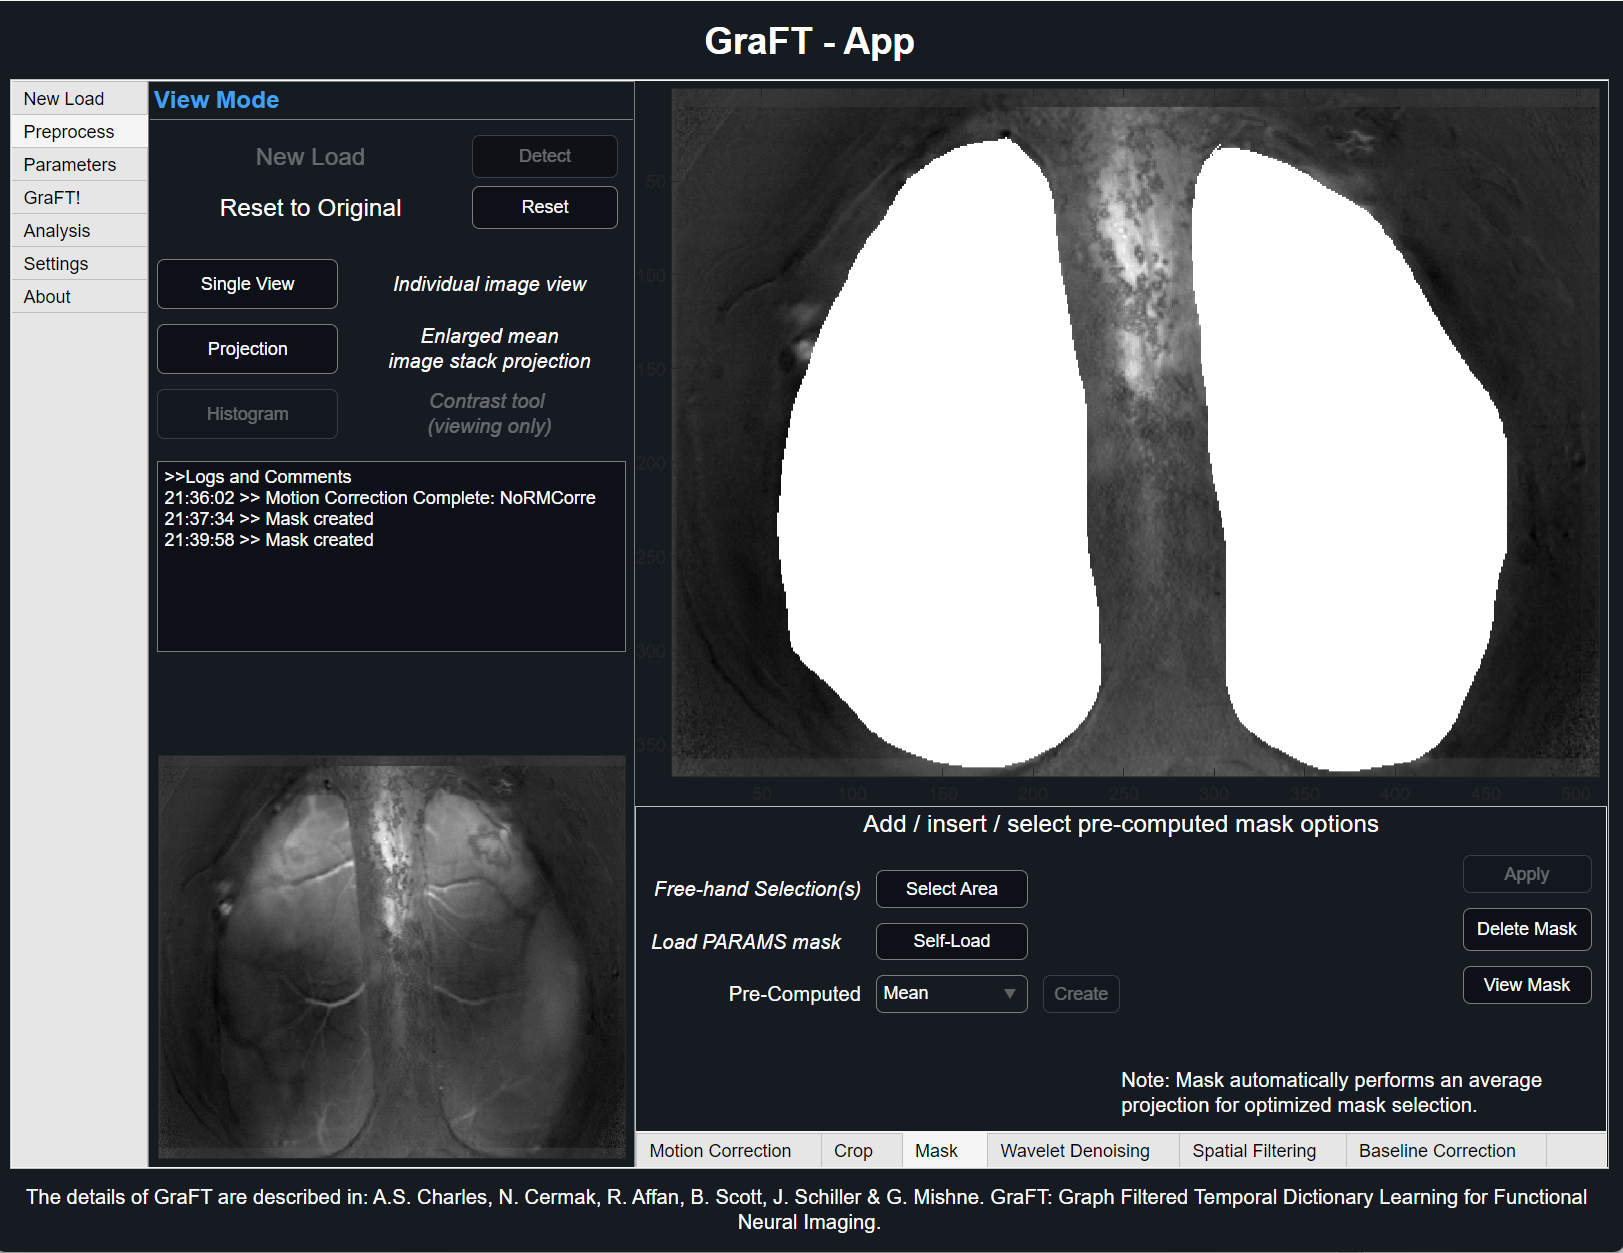
Mask
Incorporating a mask allows for only a sub-selection of the original data be used for analysis. Different from crop, adding a mask will not alter data size until it's used internally within the GraFT algorithm. When running GraFT, a temporary dataset dictated by the mask will be generated and only those pixels will be considered. Once complete, selected pixels will repopulate the original-sized dataset. To learn more about how GraFT masking works and methods used, visit our API page.
There are several ways to add a mask to your data. To create a free-hand mask, follow in-depth 'Creating Free-Hand Mask' tutorial below.
Alternatively, a pre-existing mask can be loaded directly using the 'Self-Load' button. Accepted formats are matrices (type binary) within an independent .mat file as well as .PARAMS files used in previous GraFT algorithm runs.
Lastly, pre-computed masks (coming soon) are available. These options are threshold-determined masks utilizing varying techniques such as Otsu's method, Triangle method, Mean and Standard Deviation, and Median and Median Absolute Deviation. Select from the drop-down options desired method and view results before running GraFT.
Creating Free-Hand Mask
1Select 'Select Area' button and hover cursor over the large projection plot. Wait for the cursor to change from pointer to cross-hairs. Left-click and drag the cursor over desired area in whatever shape is required. Letting go of the left-click will darken the selection.
Change the color of the selection by clicking on 'Color' Button. Colored highlights are only available before mask is applied.
-
2
Once initial selection is complete, small circles around its perimeter will form. To edit the shape slightly along its respective axis, click and drag on one of the small circles accordingly. To move the entire mask, click and drag the highlighted area by its center.
Click on the 'Apply' button to finalize the current selection or 'Clear' to re-do the current selection. The mask area should now cover the projection plot.
Toggle the mask on/off using by clicking the 'View Mask' button.
-
3
This process can be repeated for added mask selections. Once the mask is complete, simply move to other sections. Removing the mask using the 'Delete' button will clear its entirety, not just the last mask selection.
Running GraFT Algorithm
For specific pre-processing pipelines, it may be better suited for users to upload their processed data. GraFT algorithm results can change significantly due to pre-processing approaches.
-
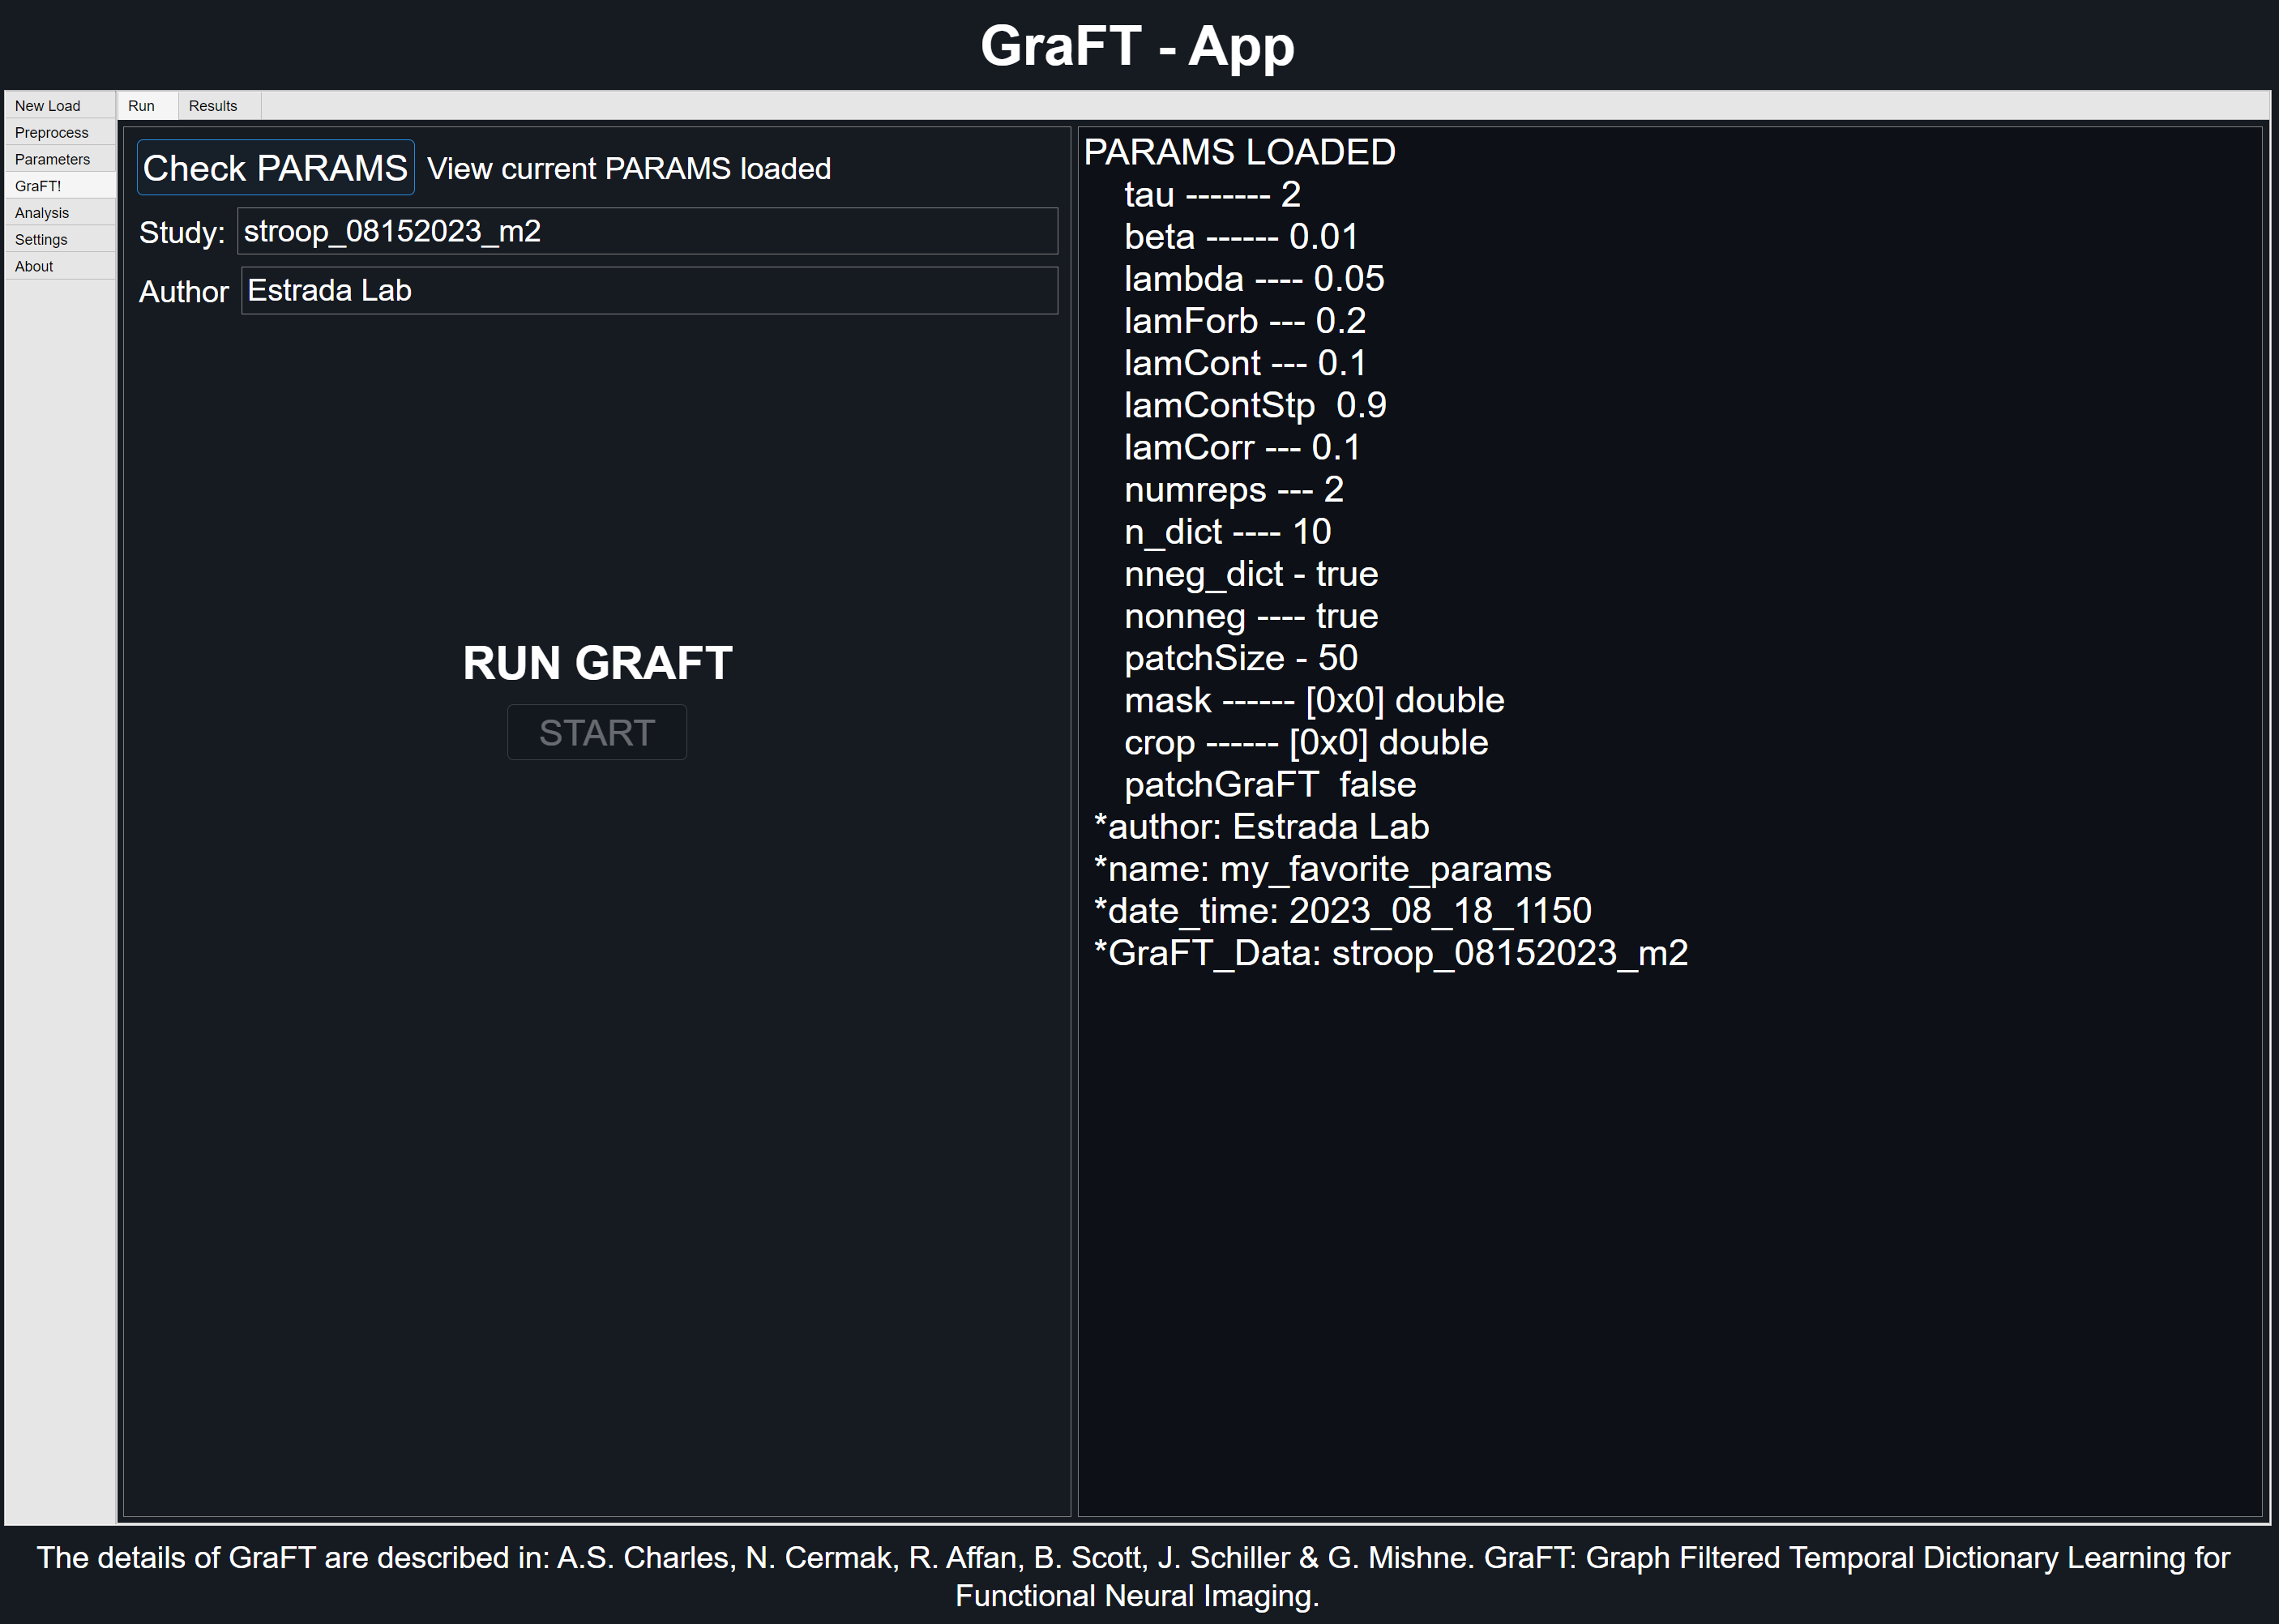
Checking Parameters
Prior to running GraFT, it is advised to perform a last check of the parameters currently loaded. For this, click the 'Check PARAMS' button on the top of the GraFT tab. A list of all current settings will be shown along with the author and study name specified in their respective text areas.
Be patient when running GraFT. If plot is enabled for non patch-GraFT studies, progress will be shown in the form of plots for each iteration. Otherwise, GraFT will run until it converges or when it finishes its last iteration.
-
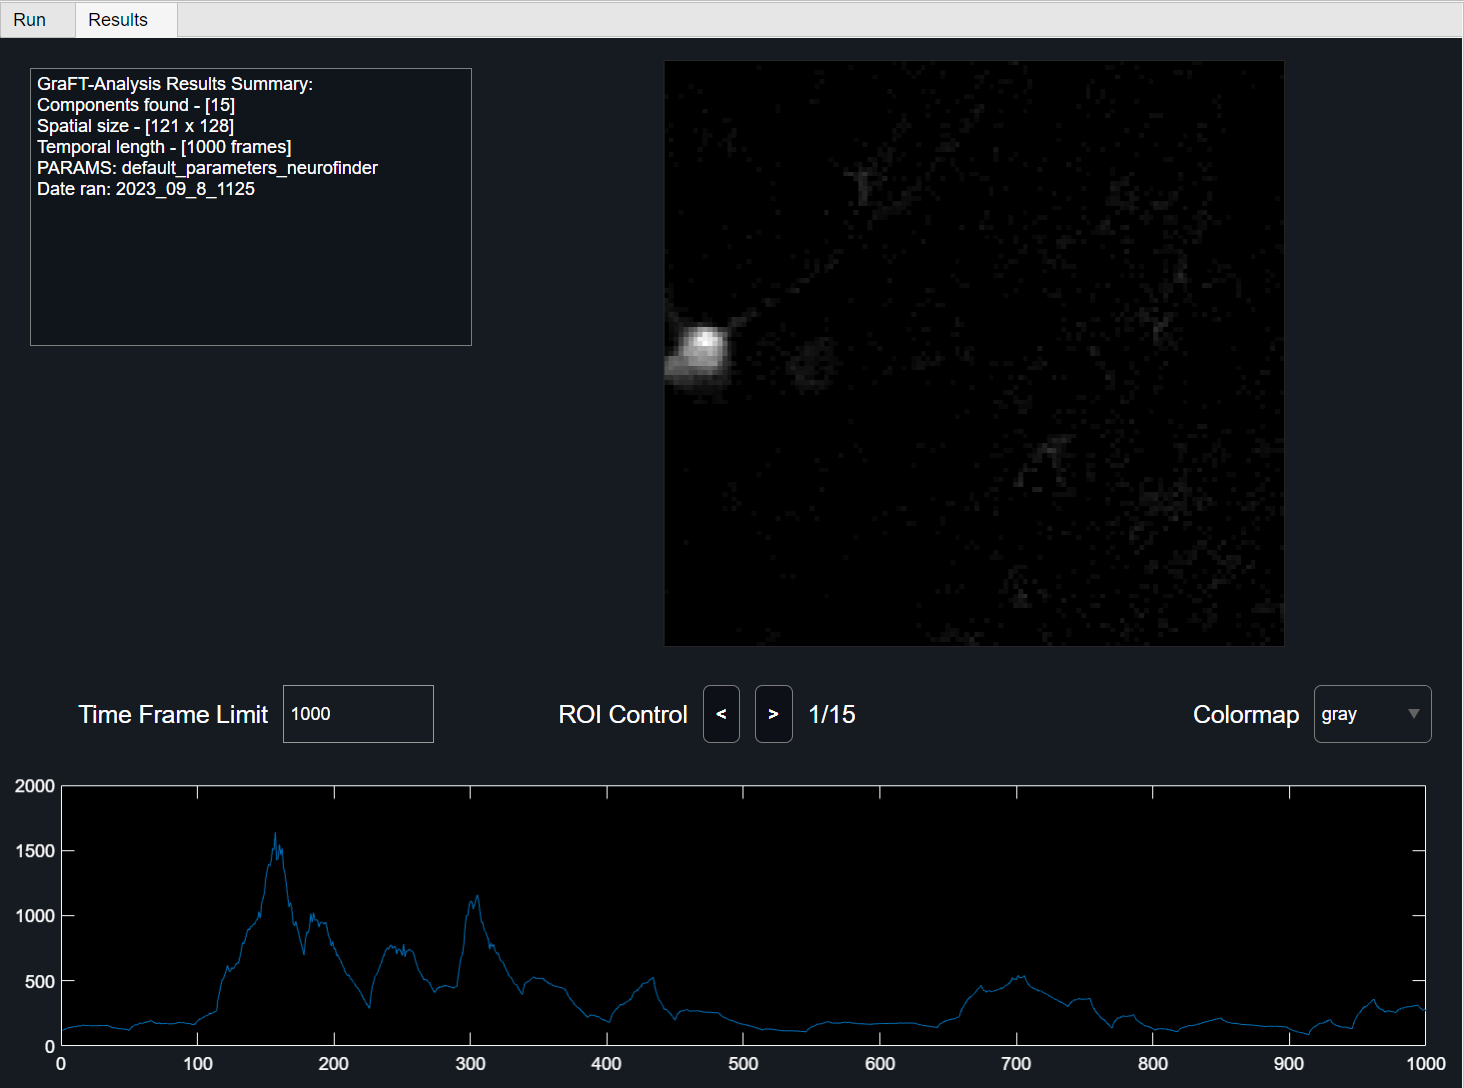
GraFT Algorithm Results
Viewing preliminary component results using the 'Results' Tab allows for user to view each component and its respective temporal results. To change the colormap for the spatial plot, use the colormap drop down menu to select between gray (default), parula, jet, and sky colormap.
Analysing GraFT Algorithm Results
In this section, we cover the tools used for analyzing GraFT-Algorithm results. To save time, it's advised to check all ROIs and reconstructed videos prior to saving to GRAFT file.
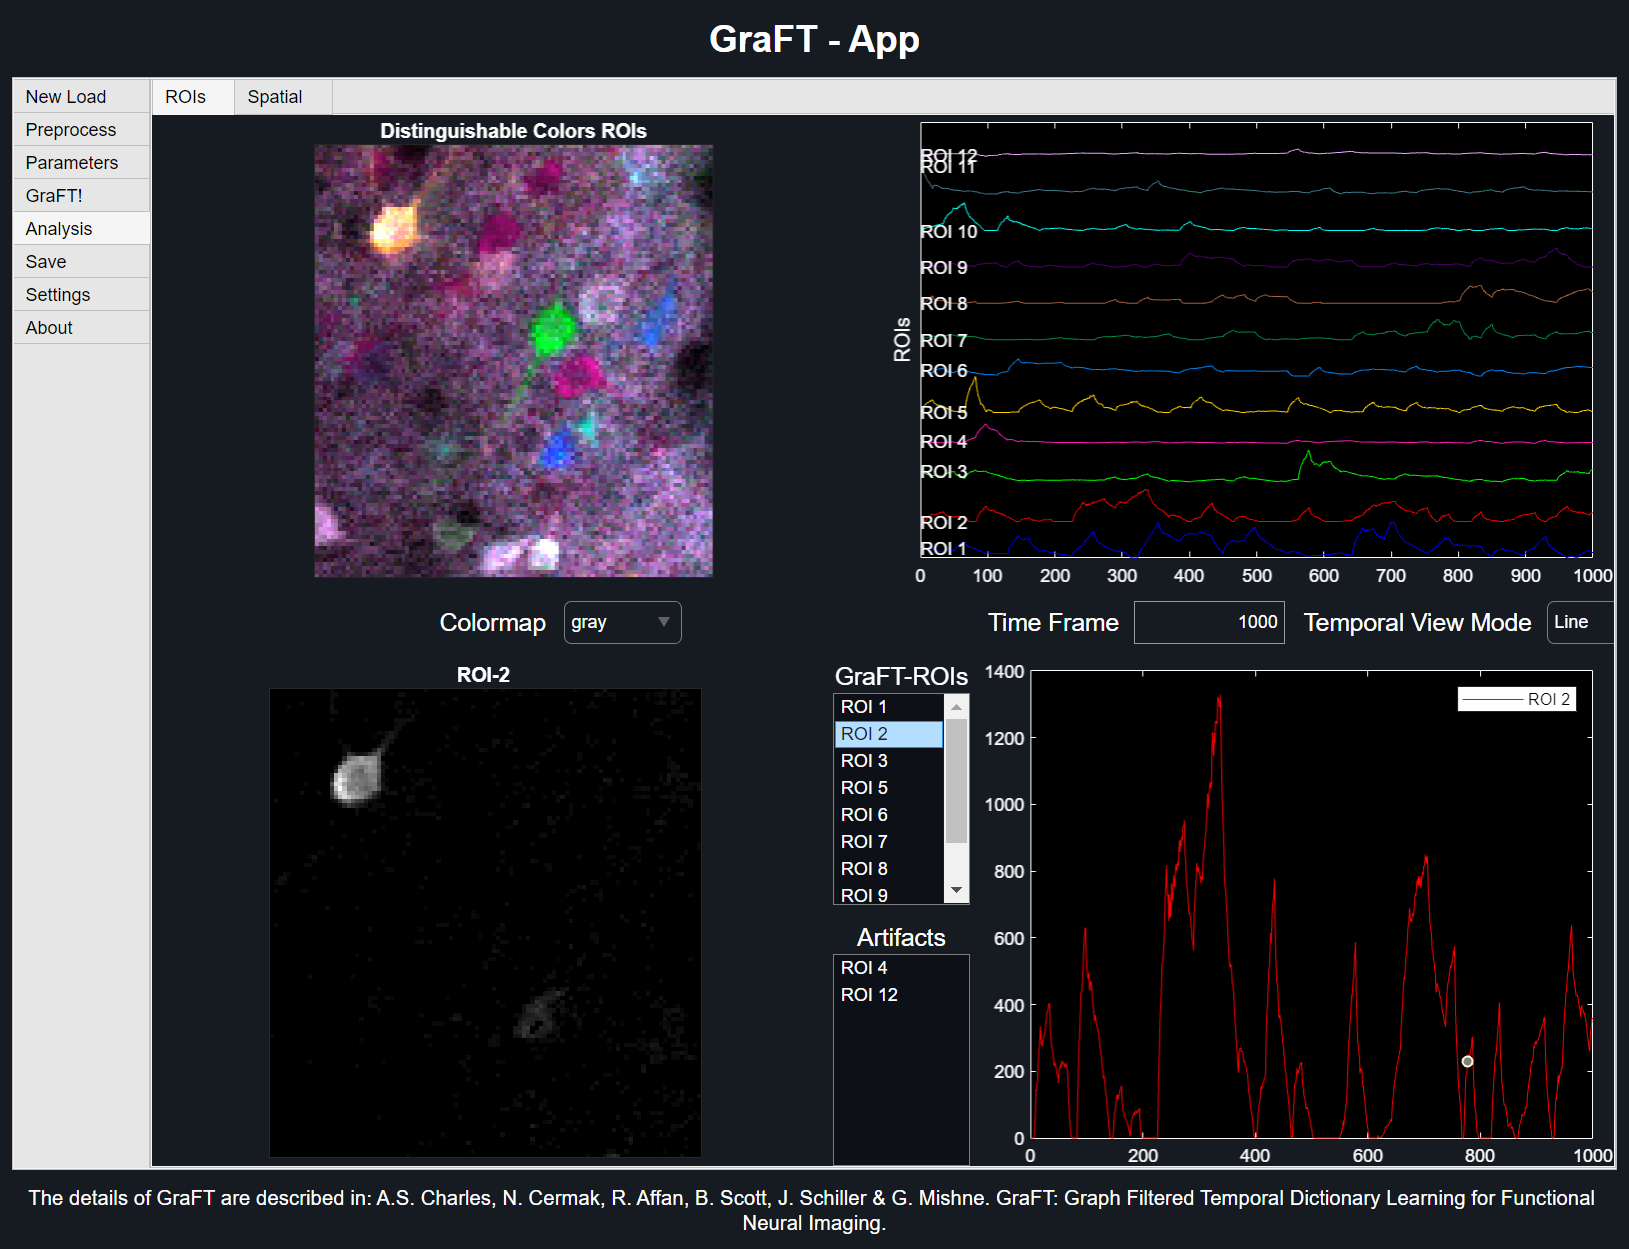
ROIs TAB
The top two plots depict the entire ROIs found. The top left plot shows the overlaid spatial results, with each ROI taking a unique distinguishable color. The top right plot shows the ROIs' temporal counterparts in a stacked line plot. The same colored ROI from the distinguishable colors plot coincides with the same colored line plot when viewed in the 'Line' Temporal View Mode.
The second option 'Image' for Temporal View Mode treats the temporal values as a scaled image, with each row representing a new ROI.
-
Viewing ROIs
Upper right plot behaviour